UNITED STATES
SECURITIES AND EXCHANGE COMMISSION
Washington, D.C. 20549
FORM 10-K
þ ANNUAL REPORT PURSUANT TO SECTION 13 OR 15(d) OF THE SECURITIES EXCHANGE ACT OF 1934
For the fiscal year ended March 30, 2019
or
¨ TRANSITION REPORT PURSUANT TO SECTION 13 OR 15(d) OF THE SECURITIES EXCHANGE ACT OF 1934
For the transition period from ______ to ______
Commission file number: 1-5256
V. F. CORPORATION
(Exact name of registrant as specified in its charter)
|
| | |
Pennsylvania | | 23-1180120 |
(State or other jurisdiction of incorporation or organization) | | (I.R.S. employer identification number) |
105 Corporate Center Boulevard
Greensboro, North Carolina 27408
(Address of principal executive offices)
(336) 424-6000
(Registrant’s telephone number, including area code)
|
| | |
Securities registered pursuant to Section 12(b) of the Act: |
(Title of each class) | (Trading Symbol(s)) | (Name of each exchange on which registered) |
Common Stock, without par value, stated capital $.25 per share | VFC | New York Stock Exchange |
0.625% Senior Notes due 2023 | VFC23 | New York Stock Exchange |
Securities registered pursuant to Section 12(g) of the Act: None
Indicate by check mark if the registrant is a well-known seasoned issuer, as defined in Rule 405 of the Securities Act. YES þ NO ¨
Indicate by check mark if the registrant is not required to file reports pursuant to Section 13 or Section 15(d) of the Act. YES ¨ NO þ
Indicate by check mark whether the registrant (1) has filed all reports required to be filed by Section 13 or 15(d) of the Securities Exchange Act of 1934 during the preceding 12 months (or for such shorter period that the registrant was required to file such reports), and (2) has been subject to such filing requirements for the past 90 days. YES þ NO ¨
Indicate by check mark whether the registrant has submitted electronically every Interactive Data File required to be submitted pursuant to Rule 405 of Regulation S-T (§ 232.405 of this chapter) during the preceding 12 months (or for such shorter period that the registrant was required to submit such files). YES þ NO ¨
Indicate by check mark whether the registrant is a large accelerated filer, an accelerated filer, a non-accelerated filer, a smaller reporting company, or an emerging growth company. See the definitions of “large accelerated filer,” “accelerated filer,” “smaller reporting company,” and “emerging growth company” in Rule 12b-2 of the Exchange Act.
Large accelerated filer þ Accelerated filer ¨
Non-accelerated filer ¨ Smaller reporting company ¨
Emerging growth company ¨
If an emerging growth company, indicate by check mark if the registrant has elected not to use the extended transition period for complying with any new or revised financial accounting standards provided pursuant to Section 13(a) of the Exchange Act. ¨
Indicate by check mark whether the registrant is a shell company (as defined in Rule 12b-2 of the Act). YES ¨ NO þ
The aggregate market value of Common Stock held by non-affiliates of V.F. Corporation on September 29, 2018, the last day of the registrant’s second fiscal quarter, was approximately $30,425,000,000 based on the closing price of the shares on the New York Stock Exchange.
As of April 27, 2019, there were 397,145,529 shares of Common Stock of the registrant outstanding.
Documents Incorporated By Reference
Portions of the definitive Proxy Statement for the Annual Meeting of Shareholders to be held on July 16, 2019 (Item 1 in Part I and Items 10, 11, 12, 13 and 14 in Part III), which definitive Proxy Statement shall be filed with the Securities and Exchange Commission within 120 days after the end of the fiscal year to which this report relates.
This document (excluding exhibits) contains 120 pages.
The exhibit index begins on page 56.
PART I
V.F. Corporation, organized in 1899, is a global leader in the design, production, procurement, marketing and distribution of branded lifestyle apparel, footwear and related products. Unless the context indicates otherwise, the terms “VF,” the "Company,” “we,” “us,” and “our” used herein refer to V.F. Corporation and its consolidated subsidiaries.
Amounts and percentages for all periods discussed below reflect the results of operations and financial condition from VF’s continuing operations.
VF’s diverse portfolio meets consumer needs across a broad spectrum of activities and lifestyles. Our ability to connect with consumers, as diverse as our brand portfolio, creates a unique platform for sustainable, long-term growth. Our long-term growth strategy is focused on four drivers:
| |
• | Reshape our portfolio. Investing in our brands to realize their full potential, while ensuring the composition of our portfolio positions us to win in evolving market conditions; |
| |
• | Transform our model. Becoming consumer- and retail-centric to meet and exceed consumers' needs across all channels, and operate our business differently - from the design studio to the factory floor to the point of sale - by thinking and acting more like a vertical retailer; |
| |
• | Elevate direct-to-consumer. Investing in our direct-to-consumer business to make it the pinnacle expression of our brands, and prioritizing serving consumers through e-commerce and digitally enabled transactions; and, |
| |
• | Distort Asia. Accelerating our actions in Asia, especially China, to unlock growth opportunities for our brands in this fast-growing region. |
VF is diversified across brands, product categories, channels of distribution, geographies and consumer demographics. We own a
broad portfolio of brands in the outerwear, footwear, denim, backpack, luggage, accessory and apparel categories. Our largest brands are Vans®, The North Face®, Timberland®, Wrangler® and Lee®.
Our products are marketed to consumers through our wholesale channel, primarily in specialty stores, department stores, national chains, mass merchants, independently-operated partnership stores and with strategic digital partners. Our products are also marketed to consumers through our own direct-to-consumer operations, which include VF-operated stores, concession retail stores and brand e-commerce sites. Revenues from the direct-to-consumer business represented 33% of VF’s total Fiscal 2019 revenues. In addition to selling directly into international markets, many of our brands also sell products through licensees, agents and distributors. In Fiscal 2019, VF derived 65% of its revenues from the Americas region, 24% from the Europe region and 11% from the Asia-Pacific region.
To provide diversified products across multiple channels of distribution in different geographic areas, we balance our own manufacturing capabilities with sourcing of finished goods from independent contractors. We utilize state-of-the-art technologies for inventory replenishment that enable us to effectively and efficiently get the right assortment of products that match consumer demand.
In light of the recently completed portfolio management actions and organizational realignments, the Company realigned its internal reporting structure in the first quarter of Fiscal 2019 to reflect the organizational changes to better support and assess the operations of the business. The chief operating decision maker allocates resources and assesses performance based on a global brand view. The new reportable segments for financial reporting purposes have been identified as: Outdoor, Active, Work and Jeans.
VF Corporation Fiscal 2019 Form 10-K 1
The following table summarizes VF’s primary brands by reportable segment:
|
| | | | |
REPORTABLE SEGMENT | | PRIMARY BRANDS | | PRIMARY PRODUCTS |
| | | | |
| | | | |
Outdoor | | The North Face® | | High performance outdoor apparel, footwear, equipment, accessories |
| | Timberland® (excluding Timberland PRO®) | | Outdoor lifestyle footwear, apparel, accessories |
| | Icebreaker® (1) | | High performance apparel based on natural, plant-based, recycled fibers |
| | Smartwool® | | Performance merino wool and other natural fibers-based apparel and accessories |
| | Altra® (2) | | Performance-based footwear |
| | | | |
| | | | |
Active | | Vans® | | Youth culture/action sports-inspired footwear, apparel, accessories |
| | Kipling® | | Handbags, luggage, backpacks, totes, accessories |
| | Napapijri® | | Premium outdoor apparel, footwear, accessories |
| | Eastpak® | | Backpacks, luggage |
| | JanSport® | | Backpacks, luggage |
| | Reef® (3) | | Surf-inspired apparel, footwear, accessories |
| | Eagle Creek® | | Luggage, backpacks, travel accessories |
| | | | |
| | | | |
Work | | Dickies® | | Work and work-inspired lifestyle apparel and footwear |
| | Red Kap® | | Occupational apparel |
| | Bulwark® | | Protective occupational apparel |
| | Timberland PRO® | | Protective work footwear and lifestyle apparel |
| | VF Solutions® | | Uniform programs for business and governmental organizations |
| | Wrangler® RIGGS | | Work apparel, accessories |
| | Walls® | | Outdoor work and sporting apparel |
| | Terra® | | Protective work footwear |
| | Workrite® | | Protective occupational apparel |
| | Kodiak® | | Protective work footwear and lifestyle footwear |
| | Horace Small® | | Occupational apparel |
| | | | |
| | | | |
Jeans | | Wrangler® (excluding Wrangler® RIGGS) | | Denim, casual apparel, footwear, accessories |
| | Lee® | | Denim, casual apparel |
| | Lee® Riders® | | Denim, casual apparel |
| | Rock & Republic® | | Denim, casual apparel, accessories |
| |
(1) | VF acquired the Icebreaker® brand on April 3, 2018. |
| |
(2) | VF acquired the Altra® brand on June 1, 2018. |
| |
(3) | VF sold the Reef® brand on October 26, 2018. |
Financial information regarding VF’s reportable segments is included in Note 19 to the consolidated financial statements.
Our Outdoor segment is a group of authentic outdoor-based lifestyle brands. Product offerings include performance-based and outdoor apparel, footwear and equipment.
The North Face® is the largest brand in our Outdoor segment. The North Face® brand features performance-based apparel, outerwear, sportswear and footwear for men, women and children. Its equipment line includes tents, sleeping bags, backpacks and accessories. Many of The North Face® products are designed for extreme winter sport activities, such as high altitude
mountaineering, skiing, snowboarding, and ice and rock climbing. The North Face® products are marketed globally, primarily through specialty outdoor and premium sporting goods stores, independent distributors, independently-operated partnership stores, concession retail stores, over 200 VF-operated stores, on brand websites with strategic digital partners and online at www.thenorthface.com.
The Timberland® (excluding Timberland PRO®) brand offers outdoor, adventure-inspired lifestyle footwear, apparel and
2 VF Corporation Fiscal 2019 Form 10-K
accessories that combine performance benefits and versatile styling for men, women and children. We sell Timberland® (excluding Timberland PRO®) products globally through chain, department and specialty stores, independent distributors and licensees, independently-operated partnership stores, concession retail stores, approximately 250 VF-operated stores, on brand websites with strategic digital partners and online at www.timberland.com.
The Icebreaker® brand was acquired on April 3, 2018. Icebreaker® specializes in performance apparel and accessories based on natural fibers, including Merino wool and other plant-based fibers. Icebreaker® products are sold globally through premium outdoor and specialty stores, independent distributors, over 30 VF-operated stores, on brand websites with strategic digital partners and online at www.icebreaker.com.
The Smartwool® brand offers active outdoor consumers a premium, technical layering system of merino wool socks, apparel
and accessories that are designed to work together in fit, form and function. Smartwool® products are sold globally through premium outdoor and specialty stores, independent distributors, on brand websites with strategic digital partners and online at www.smartwool.com.
The Altra® brand was acquired by VF on June 1, 2018. Altra® is a performance-based footwear brand primarily in the road and trail running categories. Altra® products are sold through premium outdoor and specialty stores, independent distributors, on brand websites with strategic digital partners and online at www.altrarunning.com.
We expect continued long-term growth in our Outdoor segment as we focus on product innovation, extend our brands into new product categories, open additional VF-operated stores, grow our e-commerce presence, expand wholesale channel partnerships, develop geographically and acquire additional brands.
Our Active segment is a group of activity-based lifestyle brands. Product offerings include active apparel, footwear and accessories.
Vans® is the largest brand in our Active segment. The Vans® brand offers performance and casual footwear and apparel targeting younger consumers that sit at the center of action sports, art, music and street fashion. Vans® products are available globally through chain stores, specialty stores, independent distributors and licensees, independently-operated partnership stores, concession retail stores, more than 700 VF-operated stores, on brand websites with strategic digital partners and online at www.vans.com.
Kipling® branded handbags, luggage, backpacks, totes and accessories are sold globally through department, specialty and luggage stores, independently-operated partnership stores, independent distributors, concession retail stores, home shopping television, more than 80 VF-operated stores, on brand websites with strategic digital partners and online at www.kipling.com.
The Napapijri® brand offers outdoor-inspired casual outerwear, sportswear and accessories at a premium price. Products are marketed to men, women and children in Europe, the Middle East, Asia and Africa. Products are sold in department and specialty stores, independently-operated partnership stores, concession retail stores, independent distributors, more than 25 VF-operated stores, on brand websites with strategic digital partners and online at www.napapijri.com.
Eastpak® backpacks, travel bags and luggage are sold primarily through department and specialty stores across Europe, on brand
websites with strategic digital partners, throughout Asia by distributors and online at www.eastpak.com.
JanSport® backpacks and accessories are sold in North America, South America and Asia through department, office supply and chain stores, as well as sports specialty stores and independent distributors. JanSport® products are also sold on brand websites with strategic digital partners and online at www.jansport.com.
The Reef® brand of surf-inspired products includes sandals, shoes, swimwear, casual apparel and accessories for men, women and children. Products were sold globally through specialty stores, sporting goods chains, department stores and independent distributors. Products were also sold on brand websites with strategic digital partners and online at www.reef.com. VF sold the Reef® brand on October 26, 2018.
Eagle Creek® adventure travel gear products include luggage, backpacks and accessories sold through specialty luggage, outdoor and department stores primarily in North America and Europe, on brand websites with strategic digital partners and online at www.eaglecreek.com.
We expect continued long-term growth in our Active segment as we focus on product innovation, extend our brands into new product categories, open additional VF-operated stores, grow our e-commerce presence, expand wholesale channel partnerships, develop geographically and acquire additional brands.
Our Work segment consists of work and work-inspired lifestyle apparel and footwear and occupational apparel sold through direct-to-consumer, wholesale and business-to-business ("BTB") channels.
The Work segment provides uniforms and career occupational apparel for workers in North America and internationally, under the Dickies® and Red Kap® brands (work apparel and footwear),
the Bulwark® and Workrite® brands (flame resistant and protective apparel primarily for the petrochemical, utility and mining industries), the Timberland PRO® brand (premium work footwear and apparel), the Wrangler® RIGGS brand (work apparel), the VF Solutions® brand (uniform programs for business and governmental organizations), the Walls® brand (outdoor workwear), the Kodiak® brand (work and lifestyle footwear), the Terra® brand (work footwear) and the Horace Small® brand (apparel
VF Corporation Fiscal 2019 Form 10-K 3
for law enforcement and public safety personnel). Products include a wide range of workwear pants, coveralls, shirts, medical scrubs, outerwear, footwear and accessories. Work segment revenues are influenced by the general level of business activity in each market.
Work segment BTB channels include industrial laundries and independent distributors who in turn supply customized workwear to employers for production, service and white-collar personnel. Since industrial laundries and distributors maintain minimal inventories of work clothes, VF’s ability to offer rapid delivery of products in a broad range of sizes is an important advantage in this market. Our commitment to customer service, supported by an automated central distribution center with several satellite locations, enables customer orders to be filled within 24 hours of receipt. The Red Kap®, Bulwark®, Dickies® and Workrite® brands have a strong presence in the reseller distributor market.
The BTB business also develops and manages uniform programs through custom-designed websites for major business customers and governmental organizations. These websites provide the employees of our customers with the convenience of shopping for their work and career apparel via the Internet.
Work segment products are also available on a wholesale basis, including product offerings at mass and specialty retailers, and a direct-to-consumer basis through our e-commerce sites at www.dickies.com, www.timberland.com, www.wrangler.com, www.kodiakboots.com and www.walls.com, and over 65 VF-operated retail stores. The Dickies® brand, with a strong workwear heritage, is a leader in this area with products that address the workers' needs on the job and work-inspired product that allows the worker to stay involved with the brand while in a non-traditional work-setting. The Timberland PRO® and Wrangler® RIGGS brands are also contributors in this area with products that provide comfort, durability and performance.
We believe there is a strategic opportunity for growth in our Work segment in both existing and future markets and all channels and geographies by introducing innovative products that address workers’ desires for increased comfort and performance, combined with our unique service model and increased presence in the retail workwear market.
Our Jeans segment markets denim and related casual apparel products globally.
The Wrangler® (excluding Wrangler® RIGGS) brand offers denim, apparel, accessories and footwear through mass merchants, specialty stores and mid-tier and traditional department stores in the U.S., VF-operated stores and online at www.wrangler.com. Wrangler® westernwear is distributed primarily through western specialty stores, as well as various online retail sites.
Lee® brand products are sold through mid-tier and traditional department stores in the U.S., and online at www.lee.com. The Lee® Riders® brand is marketed to mass merchant and regional discount stores in the U.S. Our Rock & Republic® brand has an exclusive wholesale distribution and licensing arrangement with Kohl’s Corporation that covers all branded apparel, accessories and other merchandise in the U.S.
Wrangler® and Lee® products outside of the U.S. are positioned as higher fashion and have higher selling prices. VF’s largest international jeanswear businesses are located in Europe and Asia, where Wrangler® and Lee® products are sold through department, specialty and concession retail stores, independently-operated partnership stores, online at www.wrangler.com and www.lee.com and on brand websites with strategic digital accounts. We also market Wrangler® and Lee® products to mass merchant, department and specialty stores in Canada and Mexico. In addition, we currently have approximately 45 VF-operated stores primarily
located in Europe and Asia, which are an important vehicle for representing our brands' image and marketing message directly to consumers. In international markets where VF does not have retail operations, Wrangler® and Lee® products are marketed through distributors, agents, licensees and single-brand or multi-brand partnership stores.
Our world-class supply chain, including owned manufacturing facilities, coupled with advanced vendor-managed inventory and retail floor space management programs with many of our major retailer customers, gives us a competitive advantage in our U.S. jeanswear business. We receive periodic point-of-sale information from these customers, at the individual store and style-size-color stock keeping unit level. We then ship products based on that customer data to ensure their selling floors are appropriately stocked with products that match their shoppers’ needs. Our system capabilities allow us to analyze our retail customers’ sales, demographic and geographic data to develop product assortment recommendations that maximize the productivity of their jeanswear selling space and optimize their inventory investment.
On August 13, 2018, VF announced its intention to spin-off its Jeans business, which includes the Wrangler®, Lee® and Rock & Republic® brands, into an independent, publicly traded company. The spin-off was completed on May 22, 2019. The Jeans business, which also includes the Wrangler® RIGGS brand and the VF Outlet™ business, represented approximately 19% of VF revenue and operating income during the year ended March 2019 on a VF-historical reporting basis.
4 VF Corporation Fiscal 2019 Form 10-K
|
|
DIRECT-TO-CONSUMER OPERATIONS |
Our direct-to-consumer business includes full-price stores, outlet stores, e-commerce sites and concession retail locations. Direct-to-consumer revenues were 33% of total VF revenues in the year ended March 2019.
Our full-price stores allow us to display a brand’s full line of products with fixtures and imagery that support the brand’s positioning and promise to consumers. These experiences provide high visibility for our brands and products and enable us to stay close to the needs and preferences of our consumers. The complete and impactful presentation of products in our stores also helps to increase sell-through of VF products at our wholesale customers due to increased brand awareness, education and visibility. VF-operated full-price stores generally provide gross margins that are well above VF averages.
In addition, VF operates outlet stores in both premium outlet malls and more traditional value-based locations. These outlet stores carry merchandise that is specifically designed for sale in our outlet stores and serve an important role in our overall inventory management and profitability by allowing VF to sell a significant portion of excess, discontinued and out-of-season products at better prices than otherwise available from outside parties, while maintaining the integrity of our brands.
Our growing global direct-to-consumer operations included 1,551 stores at the end of Fiscal 2019. We operate retail store locations for the following brands: Vans®, Timberland®, The North Face®, Kipling®, Dickies®, Lee®, Napapijri®, Icebreaker® and Wrangler®. We also operate 79 VF Outlet™ stores in the U.S. that sell a broad selection of excess VF products, as well as other non-VF products. Approximately 66% of VF-operated stores offer products at full price, and the remainder are outlet locations. Approximately 60% of our stores are located in the Americas region (48% in the U.S.),
24% in the Europe region and 16% in the Asia-Pacific region. Additionally, we have approximately 1,200 concession retail stores located principally in Europe and Asia.
E-commerce represented approximately 25% of our direct-to-consumer business in the year ended March 2019. The following brands are marketed online: Vans®, The North Face®, Timberland® (excluding Timberland PRO®), Dickies®, Lee®, Icebreaker®, Wrangler® (excluding Wrangler® RIGGS), Kipling®, Smartwool®, Eastpak®, Napapijri®, JanSport®, Altra®, Timberland PRO®, Reef®, Wrangler® RIGGS, Eagle Creek®, Walls®, Lee® Riders® and Kodiak®. We continue to expand our e-commerce initiatives by rolling out additional, country-specific brand sites in Europe and Asia, which enhances our ability to deliver a superior, localized consumer experience.
We expect our direct-to-consumer business to continue growing as we expand our e-commerce presence and open new stores. We opened 110 stores during Fiscal 2019, concentrating on the brands with the highest retail growth potential: Vans® and The North Face®.
In addition to our direct-to-consumer operations, our licensees, distributors and other independent parties own and operate over 3,000 partnership stores. These are primarily mono-brand retail locations selling VF products that have the appearance of VF-operated stores. Most of these partnership stores are located in Europe and Asia, and are concentrated in the Timberland®, The North Face®, Vans®, Lee®, Dickies®, Wrangler®, Kipling® and Napapijri® brands.
The VF Outlet™ business and stores are included in the spin-off of the Jeans business that was completed on May 22, 2019, which is also discussed in the "Jeans Segment" section above.
As part of our strategy of expanding market penetration of VF-owned brands, we enter into licensing agreements with independent parties for specific apparel and complementary product categories when such arrangements provide more effective manufacturing, distribution and marketing than could be achieved internally. We provide support to these business partners and ensure the integrity of our brand names by taking an active role in the design, quality control, advertising, marketing and distribution of licensed products.
Licensing arrangements relate to a broad range of VF brands. License agreements are for fixed terms of generally 3 to 5 years, with conditional renewal options. Each licensee pays royalties to VF based on its sales of licensed products, with most agreements providing for a minimum royalty requirement. Royalties generally range from 4% to 10% of the licensing partners’ net licensed products sales. Royalty income was $95.9 million in the year ended March 2019 (less than 1% of total revenues), primarily from the Vans®, Dickies®, Lee®, Wrangler® and Timberland® brands.
|
|
MANUFACTURING, SOURCING AND DISTRIBUTION |
Product design and innovation, including fit, fabric, finish and quality, are important elements across our businesses. These functions are performed by employees located in our global supply chain organization and our branded business units across the globe.
In addition to the design functions of each brand, VF has three strategic global innovation centers that focus on technical and performance product development for apparel, footwear and jeanswear. The centers are staffed with dedicated scientists, engineers and designers who combine proprietary insights with consumer needs, and a deep understanding of technology and new
materials. These innovation centers are integral to VF’s long-term growth as they allow us to deliver new products and experiences that consistently delight consumers, which drives organic growth and higher gross margins.
VF’s centralized global supply chain organization is responsible for producing, procuring and delivering products to our customers. VF is highly skilled in managing the complexities associated with our global supply chain. VF sourced or produced approximately 560 million units spread across our brands. Our products are obtained from 19 VF-operated manufacturing facilities and approximately 700 independent contractor manufacturing facilities in
VF Corporation Fiscal 2019 Form 10-K 5
approximately 60 countries. Additionally, we operate 40 distribution centers and 1,551 retail stores. Managing this complexity is made possible by the use of a network of information systems for product development, forecasting, order management and warehouse management, along with our core enterprise resource management platforms.
In the year ended March 2019, 21% of our units were manufactured in VF-owned facilities and 79% were obtained from independent contractors. Products manufactured in VF facilities generally have a lower cost and shorter lead times than products procured from independent contractors. Products obtained from contractors in the Western Hemisphere generally have a higher cost than products obtained from contractors in Asia. However, contracting in the Western Hemisphere gives us greater flexibility, shorter lead times and allows for lower inventory levels. This combination of VF-owned and contracted production, along with different geographic regions and cost structures, provides a well-balanced, flexible approach to product sourcing. We will continue to manage our supply chain from a global perspective and adjust as needed to changes in the global production environment.
VF operates manufacturing facilities in the U.S., Mexico, Central America and the Caribbean. A significant percentage of denim bottoms and occupational apparel is manufactured in these plants, as well as a smaller percentage of footwear and other products. For these owned production facilities, we purchase raw materials from numerous U.S. and international suppliers to meet our production needs. Raw materials include products made from cotton, leather, rubber, wool, synthetics and blends of cotton and synthetic yarn, as well as thread and trim (product identification, buttons, zippers, snaps, eyelets and laces). In some instances, we contract the sewing of VF-owned raw materials into finished product with independent contractors. Fixed price commitments for fabric and certain supplies are generally set on a quarterly basis for the next quarter’s purchases. No single supplier represents more than 10% of our total cost of goods sold.
Independent contractors generally own the raw materials and ship finished, ready-for-sale products to VF. These contractors are engaged through VF sourcing hubs in Hong Kong (with satellite offices across Asia) and Panama. These hubs are responsible for managing the manufacturing and procurement of product, supplier oversight, product quality assurance, sustainability within the supply chain, responsible sourcing and transportation and shipping functions. In addition, our hubs leverage proprietary knowledge and technology to enable certain contractors to more effectively control costs and improve labor efficiency. Substantially all products in the Outdoor and Active segments, as well as a portion of products for our Work and Jeans segments, are obtained through these sourcing hubs.
Management continually monitors political risks and developments related to duties, tariffs and quotas. We limit VF’s
sourcing exposure through, among other measures: (i) diversifying geographies with a mix of VF-operated and contracted production, (ii) shifting of production among countries and contractors, (iii) sourcing production to merchandise categories where product is readily available, and (iv) sourcing from countries with tariff preference and free trade agreements. VF does not directly or indirectly source products from suppliers in countries that are prohibited by the U.S. State Department.
All VF-operated production facilities throughout the world, as well as all independent contractor facilities that manufacture VF products, must comply with VF’s Global Compliance Principles. These principles, established in 1997 and consistent with international labor standards, are a set of strict standards covering legal and ethical business practices, worker age, work hours, health and safety conditions, environmental standards and compliance with local laws and regulations. In addition, our owned factories must also undergo certification by the independent, nonprofit organization, Worldwide Responsible Accredited Production (“WRAP”), which promotes global ethics in manufacturing.
VF, through its contractor monitoring program, audits the activities of the independent businesses and contractors that produce VF products at locations across the globe. Each of the approximately 700 independent contractor facilities, including those serving our independent licensees, must be pre-certified before producing VF products. This pre-certification includes passing a factory inspection and signing a VF Terms of Engagement agreement. We maintain an ongoing audit program to ensure compliance with these requirements by using dedicated internal staff and externally contracted firms. Additional information about VF’s Code of Business Conduct, Global Compliance Principles, Terms of Engagement and Environmental Compliance Guidelines, along with a Global Compliance Report, is available on the VF website at www.vfc.com.
VF did not experience difficulty in fulfilling its raw material and contracting production needs during Fiscal 2019. Absent any material changes, VF believes it would be able to largely offset any increases in product costs through (i) the continuing shift in the mix of its business to higher margin brands, geographies and channels of distribution, (ii) increases in the prices of its products, and (iii) cost reduction efforts. The loss of any one supplier or contractor would not have a significant adverse effect on our business.
Product is shipped from our independent suppliers and VF-operated manufacturing facilities to distribution centers around the world. In some instances, product is shipped directly to our customers. Most distribution centers are operated by VF, and some support more than one brand. A portion of our distribution needs are met by contract distribution centers.
6 VF Corporation Fiscal 2019 Form 10-K
VF’s quarterly operating results vary due to the seasonality of our individual brands, and are historically stronger in the second half of the calendar year. On a quarterly basis in Fiscal 2019, revenues ranged from a low of 20% of full year revenues in the first fiscal quarter to a high of 29% in the third fiscal quarter, while operating margin ranged from a low of 6% in the fourth fiscal quarter to a high of 17% in the second fiscal quarter. This variation results primarily from the seasonal influences on revenues of our Outdoor segment, where 12% of the segment’s revenues occurred in the first fiscal quarter compared to 35% in the third fiscal quarter of Fiscal 2019. With changes in our mix of business and the growth
of our retail operations, historical quarterly revenue and profit trends may not be indicative of future trends.
Working capital requirements vary throughout the year. Working capital increases early in the calendar year as inventory builds to support peak shipping periods and then moderates later in the year as those inventories are sold and accounts receivable are collected. Cash provided by operating activities is substantially higher in the second half of the calendar year due to higher net income during that period and reduced working capital requirements, particularly during the fourth quarter of the calendar year.
|
|
ADVERTISING, CUSTOMER SUPPORT AND COMMUNITY OUTREACH |
During the year ended March 2019, our advertising and promotion expense was $845.7 million, representing 6% of total revenues. We advertise in consumer and trade publications, on radio and television and through digital initiatives including social media and mobile platforms on the Internet. We also participate in cooperative advertising on a shared cost basis with major retailers in print and digital media, radio and television. We sponsor sporting, musical and special events, as well as athletes and personalities who promote our products. We employ marketing sciences to optimize the impact of advertising and promotional spending, and to identify the types of spending that provide the greatest return on our marketing investments.
We provide advertising support to our wholesale customers, including independent partnership stores, in the form of point-of-sale fixtures and signage to enhance the presentation and brand image of our products. We also participate in shop-in-shops and concession retail arrangements, which are separate sales areas dedicated to a specific VF brand within our customers' stores and other locations, to help differentiate and enhance the presentation of our products.
We contribute to incentive programs with our wholesale customers, including cooperative advertising funds, discounts and
allowances. We also offer sales incentive programs directly to consumers in the form of discounts, rebates and coupon offers that are eligible for use in certain VF-operated stores, brand e-commerce sites and concession retail locations.
In addition to sponsorships and activities that directly benefit our products and brands, VF and its associates actively support our communities and various charities. For example, The North Face® brand has committed to programs that encourage and enable outdoor participation, such as The North Face Endurance Challenge® and The North Face Explore Fund™ programs. The Timberland® brand has a strong heritage of volunteerism, including the Path of Service™ program that offers full-time employees up to 40 hours of paid time off a year to serve their local communities through global service events such as Earth Day in the spring and Serv-a-palooza in the fall. The Wrangler® brand launched the Tough Enough to Wear Pink™ program, which honors and raises money for breast cancer survivors, and the National Patriot Program™, which funds agencies that serve wounded and fallen American military veterans and their families. The Vans® brand has hosted annual Vans® Earth Day and Vans® Gives Back Day events in which all employees at the brand's headquarters spend the day volunteering in the community.
VF is one of the world’s largest apparel, footwear and accessories companies and has a responsibility to make a positive impact on our industry and planet through advancing sustainable business practices. VF plans to achieve significant progress in several key areas of sustainability, including people, products, supply chains, materials and facilities, to create a positive global impact.
VF’s Sustainability & Responsibility strategy, Made for Change, launched in 2017, targets key areas to drive transformational change and create value for our business. The strategy is focused on new circular and sustainable business models to (i) harness retail opportunities in new sectors, (ii) scale foundational social and environmental programs to lead the industry toward greater progress at a faster rate, and (iii) empower our brands, associates, and consumers to act with purpose and impact with intention.
In 2017, VF committed to measurably improve the lives of two million supply chain workers and others within their communities, by 2030. Since then, VF launched a Worker and Community Development Program with strategic initiatives focused on (i) water
and sanitation, (ii) health and nutrition, and (iii) childcare and education. These programs have already impacted over one hundred thousand people in more than 30 factories and communities. We are also prioritizing transparency to ensure our global supply chain improves the lives of people and the planet. In October 2018, VF successfully launched traceability maps to demonstrate the end-to-end (farm-to-front door) traceability of nine iconic VF-brand products. The enterprise will scale its traceability efforts over the next three years with a plan to enhance visibility across all VF brands.
Dedication to continued sustainability progress is particularly focused in the realm of VF product materials. In 2017, VF set a goal of sourcing 50% recycled nylon and polyester for products by 2025, with a targeted 35% reduction in negative impact of key materials. VF also pledged to not use fur in any of our products, in support of newly released Animal Derived Materials & Forest Derived Materials policies. VF is committed to using sustainable cotton across the organization. We have a goal to procure cotton primarily from the U.S. and Australia, since both countries use advanced and
VF Corporation Fiscal 2019 Form 10-K 7
efficient growing methods, or through the Better Cotton Initiative (“BCI”), which helps small holder farmers reduce their environmental impact while improving farmers’ livelihoods. In 2018, VF used approximately 36,000 metric tons of certified BCI cotton and 600 metric tons of organic cotton.
Progress continues to be made toward the goals set for VF internal facilities that include (i) the sourcing of 100% of electricity from renewable sources within VF-owned and operated facilities by 2025, in line with the enterprise commitment to RE100, and (ii) achieving Zero Waste at 100% of VF internal distribution center locations by 2020, with 17 facilities already certified.
VF brands are equally committed to sustainability action in their sectors. In 2018, Vans® launched a shoe recycling pilot at 23
southern California stores. Timberland® used 96% "Leather Working Group" certified leather, 75% certified BCI or organic cotton, and now produces 69% recycled, organic, or renewable products. The North Face® expanded its Climate Beneficial Wool collection, launched in 2017. These products are made in the U.S. from sustainable farms. The North Face® also launched the Renewed collection in 2018 selling previously owned, damage-and-repaired or used products. The recommerce model addresses one of the apparel industry’s biggest challenges, textile waste, and offers our products at a lower price point, which allows new consumers to experience our brands.
Competitive Factors
Our business depends on our ability to stimulate consumer demand for VF’s brands and products. VF is well-positioned to compete in the apparel, footwear and accessories sector by developing high quality, innovative products at competitive prices that meet consumer needs, providing high service levels, ensuring the right products are on the retail sales floor to meet consumer demand, investing significant amounts into existing brands and managing our brand portfolio through acquisitions and dispositions. Many of VF’s brands have long histories and enjoy strong recognition within their respective consumer segments.
Intellectual Property
Trademarks, trade names, patents and domain names, as well as related logos, designs and graphics, provide substantial value in the development and marketing of VF’s products, and are important to our continued success. We have registered this intellectual property in the U.S. and in other countries where our products are manufactured and/or sold. We vigorously monitor and enforce VF’s intellectual property against counterfeiting, infringement and violations of other rights where and to the extent legal, feasible and appropriate. In addition, we grant licenses to other parties to manufacture and sell products utilizing our intellectual property in product categories and geographic areas in which VF does not operate.
Customers
VF products are sold on a wholesale basis to specialty stores, mid-tier and traditional department stores, national chains and mass
merchants. In addition, we sell products on a direct-to-consumer basis through VF-operated stores, concession retail stores and brand e-commerce sites. Our sales in international markets are growing and represented 41% of our total revenues in the year ended March 2019, the majority of which were in Europe.
Sales to VF’s ten largest customers, all of which are retailers based in the U.S., amounted to 19% of total revenues in the year ended March 2019. Sales to the five largest customers amounted to approximately 15% of total revenues in the year ended March 2019. Sales to VF’s largest customer totaled 8% of total revenues in the year ended March 2019, the majority of which were derived from the Jeans business that was included in the spin-off completed on May 22, 2019.
Employees
VF had approximately 75,000 employees at the end of Fiscal 2019, of which approximately 42% were located in the U.S. In international markets, a significant percentage of employees are covered by trade-sponsored or governmental bargaining arrangements. Employee relations are considered to be good.
Backlog
The dollar amount of VF’s order backlog as of any date may not be indicative of actual future shipments and, accordingly, is not material to an understanding of the business taken as a whole.
The following are the executive officers of VF Corporation as of May 24, 2019. The executive officers are generally elected annually and serve at the pleasure of the Board of Directors. None of the VF Corporation executive officers have any family relationship with one another or with any of the directors of VF Corporation.
Steven E. Rendle, 59, has been Executive Chairman of the Board since November 2017, President and Chief Executive Officer of VF since January 2017 and a Director of VF since June 2015. Mr. Rendle served as President and Chief Operating Officer from June 2015 to December 2016, Senior Vice President — Americas from April 2014 until June 2015, Vice President and Group President — Outdoor &
Action Sports Americas from May 2011 until April 2014, President of VF’s Outdoor Americas businesses from 2009 to 2011, President of The North Face® brand from 2004 to 2009 and Vice President of Sales of The North Face® brand from 1999 to 2004. Mr. Rendle joined VF in 1999.
Scott A. Roe, 54, has been Executive Vice President and Chief Financial Officer of VF since March 2019. He served as Vice President and Chief Financial Officer of VF from April 2015 to February 2019, Vice President — Controller and Chief Accounting Officer of VF from February 2013 until March 2015, Vice President — Finance of VF from 2012 to 2013, Vice President — Chief Financial
8 VF Corporation Fiscal 2019 Form 10-K
Officer of VF International from 2006 to 2012 and Vice President — Chief Financial Officer of VF’s former intimate apparel business from 2002 to 2006. Mr. Roe joined VF in 1996.
Kevin D. Bailey, 58, has been Group President — APAC since January 2018. He served as President, APAC from January 2017 until December 2017, President Action Sports & VF CASA from March 2016 to December 2016, President Action Sports & the Vans® brand from April 2014 to February 2016, Global President of the Vans® brand from June 2009 to March 2014 and Vice President Direct-to-Consumer for the Vans® brand from June 2002 to November 2007. Mr. Bailey joined VF in 2004.
Scott H. Baxter, 54, has been Group President of Jeanswear since August 2018. Previously, he was Group President — Americas West since January 2018. He served as Vice President and Group President — Outdoor & Action Sports Americas from March 2016 until December 2017, Vice President and Group President — Jeanswear Americas, Imagewear and South America from May 2013 until March 2016, Vice President and Group President — Jeanswear Americas and Imagewear from 2011 until May 2013, President of Imagewear, composed of both the Image and VF's former Licensed Sports Group businesses, from 2008 to 2011 and President of VF's former Licensed Sports Group business from 2007 to 2008. Mr. Baxter joined VF in 2007.
Martino Scabbia Guerrini, 54, has been Group President — EMEA since January 2018. He served as President — VF EMEA from April 2017 until December 2017, Coalition President — Jeanswear, Sportswear and Contemporary International from January 2013 to November 2017, President — Sportswear and Contemporary EMEA from February 2009 to December 2012 and President —
Sportswear and Packs from August 2006 to January 2009. Mr. Guerrini joined VF in 2006.
Curtis A. Holtz, 56, has been Group President, Workwear since March 2019. He served as Group President — Americas East from January 2018 to February 2019, Group President — Workwear, Jeans and Sportswear from January 2017 until December 2017, President — Imagewear from July 2015 to December 2016, Chief Financial Officer of VF Imagewear and International from 2010 to 2015 and President — VF’s former intimate apparel business from 2005 to 2007. Mr. Holtz joined VF in 1990.
Bryan H. McNeill, 57, has been Vice President — Controller and Chief Accounting Officer since April 2015. He served as Controller and Supply Chain Chief Financial Officer of VF International from January 2012 until March 2015 and Controller of VF International from May 2010 until December 2011. Mr. McNeill joined VF in 1993.
Laura C. Meagher, 59, has been Executive Vice President, General Counsel and Secretary since March 2019. She served as Vice President, General Counsel and Secretary from 2012 to February 2019. She served as Vice President — Deputy General Counsel from 2008 to 2012 and Assistant General Counsel from 2004 to 2008. Ms. Meagher joined VF in 2004.
Additional information is included under the caption “Election of Directors” in VF’s definitive Proxy Statement for the Annual Meeting of Shareholders to be held July 16, 2019 (“2019 Proxy Statement”) that will be filed with the Securities and Exchange Commission within 120 days after the close of our fiscal year ended March 30, 2019, which information is incorporated herein by reference.
All periodic and current reports, registration statements and other filings that VF has filed or furnished to the Securities and Exchange Commission (“SEC”), including our annual reports on Form 10-K, quarterly reports on Form 10-Q, current reports on Form 8-K and amendments to those reports filed or furnished pursuant to Section 13(a) of the Exchange Act, are available free of charge from the SEC’s website (www.sec.gov) and public reference room at 100 F Street, NE, Washington, DC 20549 and on VF’s website at www.vfc.com. Such documents are available as soon as reasonably practicable after electronic filing of the material with the SEC. Information on the operation of the public reference room can be obtained by calling the SEC at 1-800-SEC-0330. Copies of these reports may also be obtained free of charge upon written request to the Secretary of VF Corporation, P.O. Box 21488, Greensboro, NC 27420.
The following corporate governance documents can be accessed on VF’s website: VF’s Corporate Governance Principles, Code of Business Conduct, and the charters of our Audit Committee, Talent and Compensation Committee, Finance Committee and Nominating and Governance Committee. Copies of these documents also may be obtained by any shareholder free of charge upon written request to the Secretary of VF Corporation, P.O. Box 21488, Greensboro, NC 27420.
After VF’s 2019 Annual Meeting of Shareholders, VF intends to file with the New York Stock Exchange (“NYSE”) the certification regarding VF’s compliance with the NYSE’s corporate governance listing standards as required by NYSE Rule 303A.12. Last year, VF filed this certification with the NYSE on May 10, 2018.
VF Corporation Fiscal 2019 Form 10-K 9
The following risk factors should be read carefully in connection with evaluating VF’s business and the forward-looking statements contained in this Form 10-K. Any of the following risks could materially adversely affect VF’s business, its operating results and its financial condition.
VF’s revenues and profits depend on the level of consumer spending for apparel and footwear, which is sensitive to global economic conditions and other factors. A decline in consumer spending could have a material adverse effect on VF.
The success of VF’s business depends on consumer spending on apparel and footwear, and there are a number of factors that influence consumer spending, including actual and perceived economic conditions, disposable consumer income, interest rates, consumer credit availability, unemployment, stock market performance, weather conditions, energy prices, consumer discretionary spending patterns and tax rates in the international, national, regional and local markets where VF’s products are sold. The current global economic environment is unpredictable, and adverse economic trends or other factors could negatively impact the level of consumer spending, which could have a material adverse impact on VF.
The apparel and footwear industries are highly competitive, and VF’s success depends on its ability to gauge consumer preferences and product trends, and to respond to constantly changing markets.
VF competes with numerous apparel and footwear brands and manufacturers. Competition is generally based upon brand name recognition, price, design, product quality, selection, service and purchasing convenience. Some of our competitors are larger and have more resources than VF in some product categories and regions. In addition, VF competes directly with the private label brands of its wholesale customers. VF’s ability to compete within the apparel and footwear industries depends on our ability to:
| |
• | Anticipate and respond to changing consumer preferences and product trends in a timely manner; |
| |
• | Develop attractive, innovative and high quality products that meet consumer needs; |
| |
• | Maintain strong brand recognition; |
| |
• | Price products appropriately; |
| |
• | Provide best-in-class marketing support and intelligence; |
| |
• | Ensure product availability and optimize supply chain efficiencies; |
| |
• | Obtain sufficient retail store space and effectively present our products at retail; |
| |
• | Produce or procure quality products on a consistent basis; and, |
| |
• | Adapt to a more digitally driven consumer landscape. |
Failure to compete effectively or to keep pace with rapidly changing consumer preferences, markets and product trends could have a material adverse effect on VF’s business, financial condition and results of operations. Moreover, there are significant shifts underway in the wholesale and retail (e-commerce and retail store) channels. VF may not be able to manage its brands within and across channels sufficiently, which could have a material adverse
effect on VF’s business, financial condition and results of operations.
VF’s results of operations could be materially harmed if we are unable to accurately forecast demand for our products.
There can be no assurance that we will be able to successfully anticipate changing consumer preferences and product trends or economic conditions, and, as a result, we may not successfully manage inventory levels to meet our future order requirements. We often schedule internal production and place orders for products with independent manufacturers before our customers’ orders are firm. If we fail to accurately forecast consumer demand, we may experience excess inventory levels or a shortage of product required to meet the demand. Inventory levels in excess of consumer demand may result in inventory write-downs, the sale of excess inventory at discounted prices or excess inventory held by our wholesale customers, which could have a negative impact on future sales, an adverse effect on the image and reputation of VF’s brands and negatively impact profitability. On the other hand, if we underestimate demand for our products, our manufacturing facilities or third-party manufacturers may not be able to produce products to meet consumer requirements, and this could result in delays in the shipment of products and lost revenues, as well as damage to VF’s reputation and relationships. These risks could have a material adverse effect on our brand image as well as our results of operations and financial condition.
VF’s business and the success of its products could be harmed if VF is unable to maintain the images of its brands.
VF’s success to date has been due in large part to the growth of its brands’ images and VF’s customers’ connection to its brands. If we are unable to timely and appropriately respond to changing consumer demand, the names and images of our brands may be impaired. Even if we react appropriately to changes in consumer preferences, consumers may consider our brands’ images to be outdated or associate our brands with styles that are no longer popular. In addition, brand value is based in part on consumer perceptions on a variety of qualities, including merchandise quality and corporate integrity. Negative claims or publicity regarding VF, its brands or its products, including licensed products, could adversely affect our reputation and sales regardless of whether such claims are accurate. Social media, which accelerates the dissemination of information, can increase the challenges of responding to negative claims. In the past, many apparel companies have experienced periods of rapid growth in sales and earnings followed by periods of declining sales and losses. Our businesses may be similarly affected in the future. In addition, we have sponsorship contracts with a number of athletes, musicians and celebrities and feature those individuals in our advertising and marketing efforts. Actions taken by those individuals associated with our products could harm their reputations, which could adversely affect the images of our brands.
VF’s revenues and cash requirements are affected by the seasonal nature of its business.
VF’s business is increasingly seasonal, with a higher proportion of revenues and operating cash flows generated during the second half of the calendar year, which includes the fall and holiday selling seasons. Poor sales in the second half of the calendar year would have a material adverse effect on VF’s full year operating results and cause higher inventories. In addition, fluctuations in sales and
10 VF Corporation Fiscal 2019 Form 10-K
operating income in any fiscal quarter are affected by the timing of seasonal wholesale shipments and other events affecting retail sales.
VF’s profitability may decline as a result of increasing pressure on margins.
The apparel industry is subject to significant pricing pressure caused by many factors, including intense competition, consolidation in the retail industry, rising commodity and conversion costs, pressure from retailers to reduce the costs of products, changes in consumer demand and shifts to online shopping and purchasing. Consumers may increasingly seek markdown allowances, incentives and other forms of economic support. If these factors cause us to reduce our sales prices to retailers and consumers, and we fail to sufficiently reduce our product costs or operating expenses, VF’s profitability will decline. This could have a material adverse effect on VF’s results of operations, liquidity and financial condition.
VF may not succeed in its business strategy.
One of VF’s key strategic objectives is growth. We seek to grow organically and through acquisitions. We seek to grow by building our lifestyle brands, expanding our share with winning customers, stretching VF’s brands to new regions, managing costs, leveraging our supply chain and information technology capabilities across VF and expanding our direct-to-consumer business, including opening new stores, remodeling and expanding our existing stores and growing our e-commerce business. However, we may not be able to grow our existing businesses. For example:
| |
• | We may have difficulty completing acquisitions or dispositions to reshape our portfolio, and we may not be able to successfully integrate a newly acquired business or achieve the expected growth, cost savings or synergies from such integration. |
| |
• | We may not be able to transform our model to be more consumer- and retail-centric. |
| |
• | We may not be able to expand our market share with winning customers, or our wholesale customers may encounter financial difficulties and thus reduce their purchases of VF products. |
| |
• | We may not be able to expand our brands in Asia or other geographies or achieve the expected results from our supply chain initiatives. |
| |
• | We may have difficulty recruiting, developing or retaining qualified employees. |
| |
• | We may not be able to achieve our direct-to-consumer expansion goals, manage our growth effectively, successfully integrate the planned new stores into our operations or operate our new, remodeled and expanded stores profitably. |
| |
• | We may not be able to offset rising commodity or conversation costs in our product costs with pricing actions or efficiency improvements. |
Failure to implement our strategic objectives may have a material adverse effect on VF’s business.
VF relies significantly on information technology. Any inadequacy, interruption, integration failure or security failure of this technology could harm VF’s ability to effectively operate its business.
Our ability to effectively manage and operate our business depends significantly on information technology systems. We rely heavily on information technology to track sales and inventory and manage our supply chain. We are also dependent on information technology, including the Internet, for our direct-to-consumer sales, including our e-commerce operations and retail business credit card transaction authorization. Despite our preventative efforts, our systems and those of our third-party service providers may be vulnerable to damage, failure or interruption due to viruses, data security incidents, technical malfunctions, natural disasters or other causes, or in connection with upgrades to our system or the implementation of new systems. The failure of these systems to operate effectively, problems with transitioning to upgraded or replacement systems, difficulty in integrating new systems or systems of acquired businesses or a breach in security of these systems could adversely impact the operations of VF’s business, including management of inventory, ordering and replenishment of products, manufacturing and distribution or products, e-commerce operations, retail business credit card transaction authorization and processing, corporate email communications and our interaction with the public on social media.
VF is subject to data security and privacy risks that could negatively affect its business operations, results of operations or reputation.
In the normal course of business, we often collect, retain and transmit certain sensitive and confidential customer information, including credit card information, over public networks. There is a significant concern by consumers and employees over the security of personal information transmitted over the Internet, identity theft and user privacy. Data security attacks are increasingly sophisticated, and if unauthorized parties gain access to our networks or databases, or those of our third-party service providers, they may be able to steal, publish, delete or modify our private and sensitive information, including credit card information and personal information. Despite the security measures we currently have in place, our facilities and systems and those of our third-party service providers may be vulnerable and unable to anticipate or detect security breaches and data loss. In addition, employees may intentionally or inadvertently cause data security breaches that result in the unauthorized release of personal or confidential information. VF and its customers could suffer harm if valuable business data, or employee, customer and other proprietary information were corrupted, lost or accessed or misappropriated by third parties due to a security failure in VF’s systems or one of our third-party service providers. It could require significant expenditures to remediate any such failure or breach, severely damage our reputation and our relationships with customers, results in unwanted media attention and lost sales, and expose us to risks of litigation and liability. In addition, as a result of recent security breaches at a number of prominent retailers, the media and public scrutiny of information security and privacy has become more intense and the regulatory environment has become increasingly uncertain, rigorous and complex. As a result, we may incur significant costs to comply with laws regarding the protection and unauthorized disclosure of personal information and we may not be able to comply with new regulations such as the General Data Protection Regulation in the European Union and the California Consumer Privacy Act. Any failure to comply with the laws and regulations surrounding the protection of personal information could subject us to legal and reputational
VF Corporation Fiscal 2019 Form 10-K 11
risk, including significant fines for non-compliance, any of which could have a negative impact on revenues and profits.
VF’s business is exposed to the risks of foreign currency exchange rate fluctuations. VF’s hedging strategies may not be effective in mitigating those risks.
A growing percentage of VF’s total revenues (approximately 41% in Fiscal 2019) is derived from markets outside the U.S. VF’s international businesses operate in functional currencies other than the U.S. dollar. Changes in currency exchange rates affect the U.S. dollar value of the foreign currency-denominated amounts at which VF’s international businesses purchase products, incur costs or sell products. In addition, for VF’s U.S.-based businesses, the majority of products are sourced from independent contractors or VF plants located in foreign countries. As a result, the costs of these products are affected by changes in the value of the relevant currencies. Furthermore, much of VF’s licensing revenue is derived from sales in foreign currencies. Changes in foreign currency exchange rates could have an adverse impact on VF’s financial condition, results of operations and cash flows.
In accordance with our operating practices, we hedge a significant portion of our foreign currency transaction exposures arising in the ordinary course of business to reduce risks in our cash flows and earnings. Our hedging strategy may not be effective in reducing all risks, and no hedging strategy can completely insulate VF from foreign exchange risk.
Further, our use of derivative financial instruments may expose VF to counterparty risks. Although VF only enters into hedging contracts with counterparties having investment grade credit ratings, it is possible that the credit quality of a counterparty could be downgraded or a counterparty could default on its obligations, which could have a material adverse impact on VF’s financial condition, results of operations and cash flows.
There are risks associated with VF’s acquisitions.
Any acquisitions or mergers by VF will be accompanied by the risks commonly encountered in acquisitions of companies. These risks include, among other things, higher than anticipated acquisition costs and expenses, the difficulty and expense of integrating the operations, systems and personnel of the companies and the loss of key employees and customers as a result of changes in management. In addition, geographic distances may make integration of acquired businesses more difficult. We may not be successful in overcoming these risks or any other problems encountered in connection with any acquisitions.
Our acquisitions may cause large one-time expenses or create goodwill or other intangible assets that could result in significant impairment charges in the future. We also make certain estimates and assumptions in order to determine purchase price allocation and estimate the fair value of assets acquired and liabilities assumed. If our estimates or assumptions used to value these assets and liabilities are not accurate, we may be exposed to losses that may be material.
VF’s operations and earnings may be affected by legal, regulatory, political and economic risks.
Our ability to maintain the current level of operations in our existing markets and to capitalize on growth in existing and new markets is subject to legal, regulatory, political and economic risks. These include the burdens of complying with U.S. and international laws
and regulations, unexpected changes in regulatory requirements, tariffs or other trade barriers and the economic uncertainty associated with the pending exit of the United Kingdom from the European Union ("Brexit") or any other similar referendums that may be held.
A significant portion of VF's Fiscal 2019 net income was earned in jurisdictions outside the U.S. and most of our goods are manufactured outside the U.S. VF is exposed to risks of changes in U.S. policy for companies having business operations and manufacturing products outside the U.S. We cannot predict any changes to U.S. participation in or renegotiations of certain trade agreements or whether quotas, duties, taxes, exchange controls or other restrictions will be imposed by the U.S., China, the European Union or other countries on the import or export of our products, or what effect any of these actions would have on VF’s business, financial condition or results of operations. Changes in regulatory, geopolitical policies and other factors may adversely affect VF’s business or may require us to modify our current business practices. While enactment of any such change is not certain, if such changes were adopted, our costs could increase, which would reduce our earnings.
Changes in tax laws could increase our worldwide tax rate and materially affect our financial position and results of operations.
We are subject to taxation in the U.S. and numerous foreign jurisdictions. On December 22, 2017, the U.S. government enacted comprehensive tax legislation commonly referred to as the Tax Cuts and Jobs Act (the “Tax Act”), which included a broad range of tax reform proposals affecting businesses, including a reduction in the U.S. federal corporate tax rate from 35% to 21%, a one-time mandatory deemed repatriation tax on earnings of certain foreign subsidiaries that were previously tax-deferred, and a new minimum tax on certain foreign earnings. The Tax Act significantly impacted our effective tax rate for the year ended December 2017 as a result of the deemed repatriation tax, and may continue to impact several other elements of our operating model. Certain additional provisions of the Tax Act, such as a minimum tax on foreign earnings, could also apply to VF depending on certain facts and circumstances and, as a result, could increase our effective tax rate. Taxes due over a period of time as a result of the new tax law could be accelerated upon certain triggering events, including failure to pay such taxes when due. The new law made broad and complex changes to the U.S. tax code and regulatory, administrative and legislative guidance continues to be released. To the extent any future guidance differs from our preliminary interpretation of the law, it could have a material effect on our financial position and results of operations.
In addition, many countries in the European Union and around the globe have adopted and/or proposed changes to current tax laws. Further, organizations such as the Organisation for Economic Co-operation and Development have published action plans that, if adopted by countries where we do business, could increase our tax obligations in these countries. Due to the large scale of our U.S. and international business activities, many of these enacted and proposed changes to the taxation of our activities could increase our worldwide effective tax rate and harm our financial position and results of operations.
We may have additional tax liabilities.
As a global company, we determine our income tax liability in various tax jurisdictions based on an analysis and interpretation of local tax laws and regulations. This analysis requires a significant
12 VF Corporation Fiscal 2019 Form 10-K
amount of judgment and estimation and is often based on various assumptions about the future actions of the local tax authorities. These determinations are the subject of periodic U.S. and international tax audits. Although we accrue for uncertain tax positions, our accrual may be insufficient to satisfy unfavorable findings. Unfavorable audit findings and tax rulings may result in payment of taxes, fines and penalties for prior periods and higher tax rates in future periods, which may have a material adverse effect on our financial condition, results of operations or cash flows.
The Company petitioned the U.S. Tax Court to resolve an Internal Revenue Service ("IRS") dispute regarding the timing of income inclusion associated with the 2011 Timberland acquisition. The Company remains confident in our timing and treatment of the income inclusion, and therefore this matter is not reflected in our financial statements. We are vigorously defending our position, and do not expect the resolution to have a material adverse impact on the Company's financial position, results of operations or cash flows. While the IRS argues immediate income inclusion, the Company's position is to include the income over a period of years. As the matter relates to 2011, nearly half of the timing at dispute has passed with the Company including the income, and paying the related tax, on our income tax returns. The Company notes that should the IRS prevail in this timing matter, the net interest expense would be up to $130 million. Further, this timing matter is impacted by the Tax Act that reduced the U.S. corporate income tax rate from 35% to 21%. If the IRS is successful, this rate differential would increase tax expense by approximately $136 million.
VF’s balance sheet includes a significant amount of intangible assets and goodwill. A decline in the fair value of an intangible asset or of a business unit could result in an asset impairment charge, which would be recorded as an operating expense in VF’s Consolidated Statement of Income and could be material.
VF’s policy is to evaluate indefinite-lived intangible assets and goodwill for possible impairment as of the beginning of the fourth quarter of each year, or whenever events or changes in circumstances indicate that the fair value of such assets may be below their carrying amount. In addition, intangible assets that are being amortized are tested for impairment whenever events or circumstances indicate that their carrying value may not be recoverable. For these impairment tests, we use various valuation methods to estimate the fair value of our business units and intangible assets. If the fair value of an asset is less than its carrying value, we would recognize an impairment charge for the difference.
It is possible that we could have an impairment charge for goodwill or trademark and trade name intangible assets in future periods if (i) overall economic conditions in Fiscal 2020 or future years vary from our current assumptions, (ii) business conditions or our strategies for a specific business unit change from our current assumptions, (iii) investors require higher rates of return on equity investments in the marketplace, or (iv) enterprise values of comparable publicly traded companies, or of actual sales transactions of comparable companies, were to decline, resulting in lower comparable multiples of revenues and earnings before interest, taxes, depreciation and amortization and, accordingly, lower implied values of goodwill and intangible assets. A future impairment charge for goodwill or intangible assets could have a material effect on our consolidated financial position or results of operations.
VF uses third-party suppliers and manufacturing facilities worldwide for a substantial portion of its raw materials and finished products, which poses risks to VF’s business operations.
During Fiscal 2019, approximately 79% of VF’s units were purchased from independent manufacturers primarily located in Asia, with substantially all of the remainder produced by VF-owned and operated manufacturing facilities located in the U.S., Mexico, Central America and the Caribbean. Any of the following could impact our ability to produce or deliver VF products, or our cost of producing or delivering products and, as a result, our profitability:
| |
• | Political or labor instability in countries where VF’s facilities, contractors and suppliers are located; |
| |
• | Changes in local economic conditions in countries where VF’s facilities, contractors, and suppliers are located; |
| |
• | Political or military conflict could cause a delay in the transportation of raw materials and products to VF and an increase in transportation costs; |
| |
• | Disruption at ports of entry, such as the west coast dock workers labor dispute that disrupted international trade at seaports, could cause delays in product availability and increase transportation times and costs; |
| |
• | Heightened terrorism security concerns could subject imported or exported goods to additional, more frequent or more lengthy inspections, leading to delays in deliveries or impoundment of goods for extended periods; |
| |
• | Decreased scrutiny by customs officials for counterfeit goods, leading to more counterfeit goods and reduced sales of VF products, increased costs for VF’s anti-counterfeiting measures and damage to the reputation of its brands; |
| |
• | Disruptions at manufacturing or distribution facilities caused by natural and man-made disasters; |
| |
• | Disease epidemics and health-related concerns could result in closed factories, reduced workforces, scarcity of raw materials and scrutiny or embargo of VF’s goods produced in infected areas; |
| |
• | Imposition of regulations and quotas relating to imports and our ability to adjust timely to changes in trade regulations could limit our ability to produce products in cost-effective countries that have the required labor and expertise; |
| |
• | Imposition of duties, taxes and other charges on imports; and, |
| |
• | Imposition or the repeal of laws that affect intellectual property rights. |
Although no single supplier and no one country is critical to VF’s production needs, if we were to lose a supplier it could result in interruption of finished goods shipments to VF, cancellation of orders by customers and termination of relationships. This, along with the damage to our reputation, could have a material adverse effect on VF’s revenues and, consequently, our results of operations.
In addition, although we audit our third-party material suppliers and contracted manufacturing facilities and set strict compliance standards, actions by a third-party supplier or manufacturer that fail to comply could expose VF to claims for damages, financial penalties and reputational harm, any of which could have a material adverse effect in our business and operations.
VF Corporation Fiscal 2019 Form 10-K 13
Our business is subject to national, state and local laws and regulations for environmental, consumer protection, employment, privacy, safety and other matters. The costs of compliance with, or the violation of, such laws and regulations by VF or by independent suppliers who manufacture products for VF could have an adverse effect on our operations and cash flows, as well as on our reputation.
Our business is subject to comprehensive national, state and local laws and regulations on a wide range of environmental, consumer protection, employment, privacy, safety and other matters. VF could be adversely affected by costs of compliance with or violations of those laws and regulations. In addition, while we do not control their business practices, we require third-party suppliers to operate in compliance with applicable laws, rules and regulations regarding working conditions, employment practices and environmental compliance. The costs of products purchased by VF from independent contractors could increase due to the costs of compliance by those contractors.
Failure by VF or its third-party suppliers to comply with such laws and regulations, as well as with ethical, social, product, labor and environmental standards, or related political considerations, could result in interruption of finished goods shipments to VF, cancellation of orders by customers and termination of relationships. If one of our independent contractors violates labor or other laws, implements labor or other business practices or takes other actions that are generally regarded as unethical, it could jeopardize our reputation and potentially lead to various adverse consumer actions, including boycotts that may reduce demand for VF’s merchandise. Damage to VF’s reputation or loss of consumer confidence for any of these or other reasons could have a material adverse effect on VF’s results of operations, financial condition and cash flows, as well as require additional resources to rebuild VF’s reputation.
Fluctuations in wage rates and the price, availability and quality of raw materials and finished goods could increase costs.
Fluctuations in the price, availability and quality of fabrics, leather or other raw materials used by VF in its manufactured products, or of purchased finished goods, could have a material adverse effect on VF’s cost of goods sold or its ability to meet its customers’ demands. The prices we pay depend on demand and market prices for the raw materials used to produce them. The price and availability of such raw materials may fluctuate significantly, depending on many factors, including general economic conditions and demand, crop yields, energy prices, weather patterns and speculation in the commodities markets. Prices of purchased finished products also depend on wage rates in Asia and other geographic areas where our independent contractors are located, as well as freight costs from those regions. Inflation can also have a long-term impact on us because increasing costs of materials and labor may impact our ability to maintain satisfactory margins. For example, the cost of the materials, that are used in our manufacturing process, such as oil-related commodity prices and other raw materials, such as cotton, dyes and chemical and other costs, such as fuel, energy and utility costs, can fluctuate as a result of inflation and other factors. Similarly, a significant portion of our products are manufactured in other countries and declines in the values of the U.S. dollar may result in higher manufacturing costs.In addition, fluctuations in wage rates required by legal or industry standards could increase our costs. In the future, VF may not be able to offset cost increases with other cost reductions or efficiencies or to pass higher costs on to its customers. This could have a material adverse effect on VF’s results of operations, liquidity and financial condition.
We may be adversely affected by weather conditions.
Our business is adversely affected by unseasonable weather conditions. A significant portion of the sales of our products is dependent in part on the weather and is likely to decline in years in which weather conditions do not favor the use of these products. For example, periods of unseasonably warm weather in the fall or winter can lead to inventory accumulation by our wholesale customers, which can, in turn, negatively affect orders in future seasons. In addition, abnormally harsh or inclement weather can also negatively impact retail traffic and consumer spending. Any and all of these risks may have a material adverse effect on our financial condition, results of operations or cash flows.
A substantial portion of VF’s revenues and gross profit is derived from a small number of large customers. The loss of any of these customers or the inability of any of these customers to pay VF could substantially reduce VF’s revenues and profits.
A few of VF’s customers account for a significant portion of revenues. Sales to VF’s ten largest customers were 19% of total revenues in Fiscal 2019, with our largest customer accounting for 8% of revenues. Sales to our customers are generally on a purchase order basis and not subject to long-term agreements. A decision by any of VF’s major customers to significantly decrease the volume of products purchased from VF could substantially reduce revenues and have a material adverse effect on VF’s financial condition and results of operations.
The retail industry has experienced financial difficulty that could adversely affect VF's business.
Recently there have been consolidations, reorganizations, restructurings, bankruptcies and ownership changes in the retail industry. These events individually, and together, could materially, adversely affect VF's business. These changes could impact VF’s opportunities in the market and increase VF’s reliance on a smaller number of large customers. In the future, retailers are likely to further consolidate, undergo restructurings or reorganizations or bankruptcies, realign their affiliations or reposition their stores’ target markets. In addition, consumers have continued to transition away from traditional wholesale retailers to large online retailers. These developments could result in a reduction in the number of stores that carry VF’s products, an increase in ownership concentration within the retail industry, an increase in credit exposure to VF or an increase in leverage by VF’s customers over their suppliers.
Further, the global economy periodically experiences recessionary conditions with rising unemployment, reduced availability of credit, increased savings rates and declines in real estate and securities values. These recessionary conditions could have a negative impact on retail sales of apparel and other consumer products. The lower sales volumes, along with the possibility of restrictions on access to the credit markets, could result in our customers experiencing financial difficulties including store closures, bankruptcies or liquidations. This could result in higher credit risk to VF relating to receivables from our customers who are experiencing these financial difficulties. If these developments occur, our inability to shift sales to other customers or to collect on VF’s trade accounts receivable could have a material adverse effect on VF’s financial condition and results of operations.
14 VF Corporation Fiscal 2019 Form 10-K
Our ability to obtain short-term or long-term financing on favorable terms, if needed, could be adversely affected by geopolitical risk and volatility in the capital markets.
Any disruption in the capital markets could limit the availability of funds or the ability or willingness of financial institutions to extend capital in the future. This could adversely affect our liquidity and funding resources or significantly increase our cost of capital. An inability to access capital and credit markets may have an adverse effect on our business, results of operations, financial condition and cash flows.
VF has a global revolving credit facility. One or more of the participating banks may not be able to honor their commitments, which could have an adverse effect on VF’s business.
VF has a $2.25 billion global revolving credit facility that expires in December 2023. If the financial markets return to recessionary conditions, this could impair the ability of one or more of the banks participating in our credit agreements to honor their commitments. This could have an adverse effect on our business if we were not able to replace those commitments or to locate other sources of liquidity on acceptable terms.
The loss of members of VF’s executive management and other key employees could have a material adverse effect on its business.
VF depends on the services and management experience of its executive officers and business leaders who have substantial experience and expertise in VF’s business. The unexpected loss of services of one or more of these individuals could have a material adverse effect on VF. Our future success also depends on our ability to recruit, retain and engage our personnel sufficiently. Competition for experienced and well-qualified personnel is intense and we may not be successful in attracting and retaining such personnel.
VF’s direct-to-consumer business includes risks that could have an adverse effect on its results of operations.
VF sells merchandise direct-to-consumer through VF-operated stores and e-commerce sites. Its direct-to-consumer business is subject to numerous risks that could have a material adverse effect on its results. Risks include, but are not limited to, (i) U.S. or international resellers purchasing merchandise and reselling it overseas outside VF’s control, (ii) failure of the systems that operate the stores and websites, and their related support systems, including computer viruses, theft of customer information, privacy concerns, telecommunication failures and electronic break-ins and similar disruptions, (iii) credit card fraud, and (iv) risks related to VF’s direct-to-consumer distribution centers and processes. Risks specific to VF’s e-commerce business also include (i) diversion of sales from VF stores or wholesale customers, (ii) difficulty in recreating the in-store experience through direct channels, (iii) liability for online content, (iv) changing patterns of consumer behavior, and (v) intense competition from online retailers. VF’s failure to successfully respond to these risks might adversely affect sales in its e-commerce business, as well as damage its reputation and brands.
Our VF-operated stores and e-commerce business require substantial fixed investments in equipment and leasehold improvements, information systems, inventory and personnel. We have entered into substantial operating lease commitments for retail space. Due to the high fixed-cost structure associated with our direct-to-consumer operations, a decline in sales or the closure of or poor performance of individual or multiple stores
could result in significant lease termination costs, write-offs of equipment and leasehold improvements and employee-related costs.
VF’s net sales depend on the volume of traffic to its stores and the availability of suitable lease space.
A growing portion of our revenues are direct-to-consumer sales through VF-operated stores. In order to generate customer traffic, we locate many of our stores in prominent locations within successful retail shopping centers or in fashionable shopping districts. Our stores benefit from the ability of the retail center and other attractions in an area to generate consumer traffic in the vicinity of our stores. Part of our future growth is significantly dependent on our ability to operate stores in desirable locations with capital investment and lease costs providing the opportunity to earn a reasonable return. We cannot control the development of new shopping centers or districts; the availability or cost of appropriate locations within existing or new shopping centers or districts; competition with other retailers for prominent locations; or the success of individual shopping centers or districts. Further, if we are unable to renew or replace our existing store leases or enter into leases for new stores on favorable terms, or if we violate the terms of our current leases, our growth and profitability could be harmed. All of these factors may impact our ability to meet our growth targets and could have a material adverse effect on our financial condition or results of operations.
VF may be unable to protect its trademarks and other intellectual property rights.
VF’s trademarks and other intellectual property rights are important to its success and its competitive position. VF is susceptible to others copying its products and infringing its intellectual property rights, especially with the shift in product mix to higher priced brands and innovative new products in recent years. Some of VF’s brands, such as The North Face®, Timberland®, Vans®, JanSport®, Dickies®, Wrangler® and Lee®, enjoy significant worldwide consumer recognition, and the higher pricing of those products creates additional risk of counterfeiting and infringement.
VF’s trademarks, trade names, patents, trade secrets and other intellectual property are important to VF’s success. Counterfeiting of VF’s products or infringement on its intellectual property rights could diminish the value of our brands and adversely affect VF’s revenues. Actions we have taken to establish and protect VF’s intellectual property rights may not be adequate to prevent copying of its products by others or to prevent others from seeking to invalidate its trademarks or block sales of VF’s products as a violation of the trademarks and intellectual property rights of others. In addition, unilateral actions in the U.S. or other countries, including changes to or the repeal of laws recognizing trademark or other intellectual property rights, could have an impact on VF’s ability to enforce those rights.
The value of VF’s intellectual property could diminish if others assert rights in or ownership of trademarks and other intellectual property rights of VF, or trademarks that are similar to VF’s trademarks, or trademarks that VF licenses from others. We may be unable to successfully resolve these types of conflicts to our satisfaction. In some cases, there may be trademark owners who have prior rights to VF’s trademarks because the laws of certain foreign countries may not protect intellectual property rights to the same extent as do the laws of the U.S. In other cases, there may be holders who have prior rights to similar trademarks.
VF Corporation Fiscal 2019 Form 10-K 15
There have been, and there may in the future be, opposition and cancellation proceedings from time to time with respect to some of VF's intellectual property rights. In some cases, litigation may be necessary to protect or enforce our trademarks and other intellectual property rights. Furthermore, third parties may assert intellectual property claims against us, and we may be subject to liability, required to enter into costly license agreements, if available at all, required to rebrand our products and/or prevented from selling some of our products if third parties successfully oppose or challenge our trademarks or successfully claim that we infringe, misappropriate or otherwise violate their trademarks, copyrights, patents or other intellectual property rights. Bringing or defending any such claim, regardless or merit, and whether successful or unsuccessful, could be expensive and time-consuming and have a negative effect on VF's business, reputation, results of operations and financial condition.
VF is subject to the risk that its licensees may not generate expected sales or maintain the value of VF’s brands.
During Fiscal 2019, $95.9 million of VF’s revenues were derived from licensing royalties. Although VF generally has significant control over its licensees’ products and advertising, we rely on our licensees for, among other things, operational and financial controls over their businesses. Failure of our licensees to successfully market licensed products or our inability to replace existing licensees, if necessary, could adversely affect VF’s revenues, both directly from reduced royalties received and indirectly from reduced sales of our other products. Risks are also associated with a licensee’s ability to:
| |
• | Manage its labor relations; |
| |
• | Maintain relationships with its suppliers; |
| |
• | Manage its credit risk effectively; |
| |
• | Maintain relationships with its customers; and, |
| |
• | Adhere to VF’s Global Compliance Principles. |
In addition, VF relies on its licensees to help preserve the value of its brands. Although we attempt to protect VF’s brands through approval rights over design, production processes, quality, packaging, merchandising, distribution, advertising and promotion of our licensed products, we cannot completely control the use of licensed VF brands by our licensees. The misuse of a brand by a licensee, including through the marketing or products under one of our brand names that do not meet our quality standards, could have a material adverse effect on that brand and on VF.
If VF encounters problems with its distribution system, VF’s ability to deliver its products to the market could be adversely affected.
VF relies on owned or independently-operated distribution facilities to warehouse and ship product to its customers. VF’s distribution system includes computer-controlled and automated equipment, which may be subject to a number of risks related to security or computer viruses, the proper operation of software and hardware, power interruptions or other system failures. Because substantially all of VF’s products are distributed from a relatively small number of locations, VF’s operations could also be interrupted by earthquakes, floods, fires or other natural disasters affecting its distribution centers. We maintain business interruption insurance, but it may not adequately protect VF from the adverse effects that could be caused by significant disruptions in VF’s distribution facilities, such as the long-term loss of
customers or an erosion of brand image. In addition, VF’s distribution capacity is dependent on the timely performance of services by third parties, including the transportation of product to and from its distribution facilities. If we encounter problems with our distribution system, our ability to meet customer expectations, manage inventory, complete sales and achieve operating efficiencies could be materially adversely affected.
Volatility in securities markets, interest rates and other economic factors could substantially increase VF’s defined benefit pension costs.
VF currently has obligations under its defined benefit pension plans. The funded status of the pension plans is dependent on many factors, including returns on investment assets and the discount rate used to determine pension obligations. Unfavorable impacts from returns on plan assets, decreases in discount rates, changes in plan demographics or revisions in the applicable laws or regulations could materially change the timing and amount of pension funding requirements, which could reduce cash available for VF’s business.
VF’s operating performance also may be negatively impacted by the amount of expense recorded for its pension plans. Pension expense is calculated using actuarial valuations that incorporate assumptions and estimates about financial market, economic and demographic conditions. Differences between estimated and actual results give rise to gains and losses that are deferred and amortized as part of future pension expense, which can create volatility that adversely impacts VF’s future operating results.
The relocation of our global headquarters; The North Face®, JanSport®, Smartwool®, Altra® and Eagle Creek® brands; and VF’s Global Innovation Center for technical fabrics and Digital Lab could adversely affect our operations, operating results and financial condition, as we may experience disruptions to our business and incur additional costs in connection with the relocation.
We announced on August 13, 2018 the relocation of our global headquarters to the metro Denver area, which will also serve as the home for The North Face®, JanSport®, Smartwool®, Altra® and Eagle Creek® brands (the “Relocating Brands”) and VF’s Global Innovation Center for technical fabrics and Digital Lab (the “Innovation Center and Lab”). The process of moving our headquarters, the Relocating Brands and the Innovation Center and Lab is inherently complex and not part of our day-to-day operations. The relocation process could cause significant disruption to our operations, cause the temporary diversion of management resources and result in the loss of key employees who have substantial experience and expertise in our business, all of which could have a material adverse effect on our operations, operating results and financial condition. The need to replace Company personnel who do not relocate, train new employees and transition Company operating knowledge may cause disruptions in our business. While we have implemented a transition plan to provide for the move of our global headquarters, the Relocating Brands and the Innovation Center and Lab, including relocation benefits for employees who may be transferring, and severance and retention benefits for employees who will not be continuing with the Company after the move, we may encounter difficulties retaining employees who elect to transfer and attracting new talent in the Denver area to replace our employees who are unwilling to relocate. We may also experience difficulties in retaining employees who will remain in Greensboro during the transition period and who we are relying on to facilitate the transition of operating knowledge. In addition, we may incur additional costs for
16 VF Corporation Fiscal 2019 Form 10-K
duplication in staff as we effect the transition. We can give no assurance that the relocation will be completed as planned or within the expected timeframe. In addition, the relocation may involve significant additional costs to us and the expected benefits of the move may not be fully realized due to associated disruption to our operations and personnel.
We may be unable to achieve some or all of the benefits we expect to achieve from the spin-off.
On May 22, 2019, we completed the spin-off of our Jeans business, Kontoor Brands, Inc. ("Kontoor Brands"). Although we believe that the spin-off will enhance our long-term value, we may not be able to achieve some or all of the anticipated benefits from the separation of our businesses, and the spin-off may adversely affect our business. Separating the businesses resulted in two independent, publicly traded companies, each of which is now a smaller, less diversified and more narrowly focused business than before the spin-off, which makes us more vulnerable to changing market and economic conditions. Additionally, a potential loss of synergies from separating the businesses could negatively impact the balance sheet, profit margins or earnings of both businesses and the combined value of the common stock of the two publicly traded companies may not be equal to or greater than the value of VF common stock had the spin-off not occurred. If we fail to achieve some or all of the benefits that we expect to achieve as a result of the spin-off, or do not achieve them in the time we expect, our results of operations and financial condition could be materially adversely affected.
The Kontoor Brands spin-off could result in substantial tax liability to us and our stockholders.
We received opinions of tax advisors substantially to the effect that, for U.S. Federal income tax purposes, the spin-off and certain related transactions qualify for tax-free treatment under certain sections of the Internal Revenue Code. However, if the factual assumptions or representations made by us in connection with the delivery of the opinions are inaccurate or incomplete in any material respect, including those relating to the past and future conduct of our business, we will not be able to rely on the opinions. Furthermore, the opinions are not binding on the IRS or the courts. If, notwithstanding receipt of the opinions, the spin-off transaction and certain related transactions are determined to be taxable, we would be subject to a substantial tax liability. In addition, if the spin-
off transaction is taxable, each holder of our common stock who received shares of Kontoor Brands in connection with the spin-off would generally be treated as receiving a taxable distribution of property in an amount equal to the fair market value of the shares received.
Even if the spin-off otherwise qualifies as a tax-free transaction, the distribution would be taxable to us (but not to our stockholders) in certain circumstances if future significant acquisitions of our stock or the stock of Kontoor Brands are deemed to be part of a plan or series of related transactions that included the spin-off. In this event, the resulting tax liability could be substantial. In connection with the spin-off, we entered into a tax matters agreement with Kontoor Brands, pursuant to which Kontoor Brands agreed to not enter into any transaction that could cause any portion of the spin-off to be taxable to us without our consent and to indemnify us for any tax liability resulting from any such transaction. In addition, these potential tax liabilities may discourage, delay or prevent a change of control of us.
Certain directors who serve on our Board of Directors also serve as directors of Kontoor Brands, and ownership of shares of common stock of Kontoor Brands following the spin-off by our directors and executive officers, may create, or appear to create, conflicts of interest.
Certain of our directors who serve on our Board of Directors currently serve on the Board of Directors of Kontoor Brands. This may create, or appear to create, conflicts of interest when our or Kontoor Brands' management and directors face decisions that could have different implications for us and Kontoor Brands, including the resolution of any dispute regarding the terms of the agreements governing the spin-off and the relationship between us and Kontoor Brands after the spin-off or any other commercial agreements entered into in the future between us and Kontoor Brands.
Most of our executive officers and non-employee directors currently own shares of the common stock of Kontoor Brands. The continued ownership of such common stock by our directors and executive officers following the spin-off creates or may create the appearance of a conflict of interest when these directors and executive officers are faced with decisions that could have different implications for us and Kontoor Brands.
|
|
ITEM 1B. UNRESOLVED STAFF COMMENTS. |
None.
The following is a summary of VF Corporation’s principal owned and leased properties as of March 30, 2019.
VF’s global headquarters are located in a 180,000 square foot, owned facility in Greensboro, North Carolina. VF owns other facilities in Greensboro, including the Jeans segment headquarters building. In addition, we own facilities in Stabio, Switzerland and lease offices in Hong Kong, China, which serve as our European and Asia-Pacific regional headquarters, respectively. We also own or lease segment and brand headquarters facilities throughout the world.
VF owns a 236,000 square foot facility in Appleton, Wisconsin that serves as a shared services center for certain Outdoor, Active and Work brands in North America. Additionally, we own and lease shared service facilities in Bornem, Belgium that support our European operations. Our sourcing hubs are located in Panama City, Panama and Hong Kong, China.
Our largest distribution centers are located in Prague, Czech Republic and Visalia, California. Additionally, we operate 38 other owned or leased distribution centers primarily in the U.S., but also in Argentina, Belgium, Canada, Chile, China, Mexico, the Netherlands and the United Kingdom. We operate 19 owned or
VF Corporation Fiscal 2019 Form 10-K 17
leased manufacturing plants primarily in Mexico, but also in the Dominican Republic, Honduras, Nicaragua and the U.S.
In addition to the principal properties described above, we lease many offices worldwide for sales and administrative purposes. We operate 1,551 retail stores across the Americas, European and
Asia-Pacific regions. Retail stores are generally leased under operating leases and include renewal options. We believe all facilities and machinery and equipment are in good condition and are suitable for VF’s needs.
|
|
ITEM 3. LEGAL PROCEEDINGS. |
There are no pending material legal proceedings, other than ordinary, routine litigation incidental to the business, to which VF or any of its subsidiaries is a party or to which any of their property is the subject.
|
|
ITEM 4. MINE SAFETY DISCLOSURES. |
Not applicable.
18 VF Corporation Fiscal 2019 Form 10-K
PART II
|
|
ITEM 5. MARKET FOR VF’S COMMON EQUITY, RELATED STOCKHOLDER MATTERS AND ISSUER PURCHASES OF EQUITY SECURITIES. |
VF’s Common Stock is listed on the New York Stock Exchange under the symbol “VFC”. As of April 27, 2019 there were 3,281 shareholders of record. Quarterly dividends on VF Common Stock, when declared, are paid on or about the 20th day of June, September, December and March.
The following graph compares the cumulative total shareholder return on VF Common Stock with that of the Standard & Poor’s (“S&P”) 500 Index and the S&P 1500 Apparel, Accessories & Luxury Goods Subindustry Index (“S&P 1500 Apparel Index”) for Fiscal 2014 through Fiscal 2019. The S&P 1500 Apparel Index at the end of Fiscal 2019 consisted of Capri Holdings Limited, Carter’s, Inc., Fossil, Inc., G-III Apparel Group, Ltd., Hanesbrands Inc., Movado Group, Inc., Oxford Industries, Inc., PVH Corp., Ralph Lauren
Corporation, Tapestry, Inc., Under Armour, Inc., Vera Bradley, Inc. and VF Corporation. The graph assumes that $100 was invested at the end of Fiscal 2013 in each of VF Common Stock, the S&P 500 Index and the S&P 1500 Apparel Index, and that all dividends were reinvested. The graph plots the respective values on the last trading day of Fiscal 2013 through Fiscal 2019. Past performance is not necessarily indicative of future performance.
COMPARISON OF FIVE-YEAR CUMULATIVE TOTAL RETURN OF VF COMMON STOCK,
S&P 500 INDEX AND S&P 1500 APPAREL INDEX
VF Common Stock closing price on March 30, 2019 was $86.91
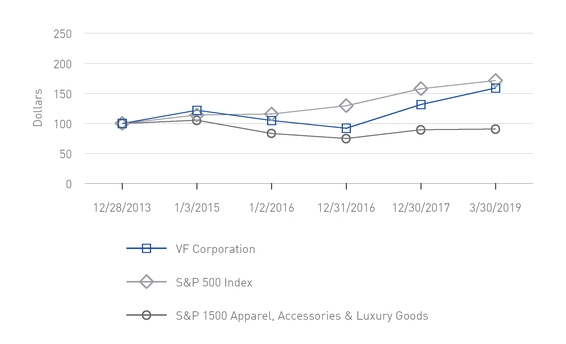
|
| | | | | | | | | | | | | | | | | | | | | | | | | | | | | | | |
Company / Index | | | Base Period 12/28/13 | | | 1/3/15 | | | 1/2/16 | | | 12/31/16 | | | 12/30/17 | | | 3/30/19 | |
VF Corporation | | | $ | 100.00 |
| | | $ | 121.81 |
| | | $ | 104.78 |
| | | $ | 92.06 |
| | | $ | 131.42 |
| | | $ | 158.92 |
| |
S&P 500 Index | | | 100.00 |
| | | 114.11 |
| | | 115.71 |
| | | 129.55 |
| | | 157.84 |
| | | 171.51 |
| |
S&P 1500 Apparel, Accessories & Luxury Goods | | | 100.00 |
| | | 105.39 |
| | | 83.41 |
| | | 75.01 |
| | | 89.53 |
| | | 90.74 |
| |
VF Corporation Fiscal 2019 Form 10-K 19
|
|
ISSUER PURCHASES OF EQUITY SECURITIES: |
The following table sets forth VF’s repurchases of our Common Stock during the fiscal quarter ended March 30, 2019 under the share repurchase program authorized by VF’s Board of Directors in 2017.
|
| | | | | | | | | | | | | | |
Fiscal Period | | Total Number of Shares Purchased | | Weighted Average Price Paid per Share | | Total Number of Shares Purchased as Part of Publicly Announced Programs | | Dollar Value of Shares that May Yet be Purchased Under the Program |
December 30, 2018 — January 26, 2019 | | — |
| | $ | — |
| | — |
| | $ | 3,836,982,574 |
|
January 27, 2019 — February 23, 2019 | | — |
| | — |
| | — |
| | 3,836,982,574 |
|
February 24, 2019 — March 30, 2019 | | — |
| | — |
| | — |
| | 3,836,982,574 |
|
Total | | — |
| | | | — |
| | |
20 VF Corporation Fiscal 2019 Form 10-K
|
|
ITEM 6. SELECTED FINANCIAL DATA. |
The following table sets forth selected consolidated financial data for the five years ended March 30, 2019 and transition period ended March 31, 2018. VF operates and reports using a 52/53 week fiscal year ending on the Saturday closest to March 31 of each year. VF previously used a 52/53 week fiscal year ending on the Saturday closest to December 31 of each year. All references to the periods ended March 2019, December 2017, December 2016 and December 2015 relate to the 52-week fiscal years ended March 30, 2019, December 30, 2017, December 31, 2016 and January 2, 2016, respectively, and all references to the period ended December 2014 relate to the 53-week fiscal year ended January 3, 2015. All references to the period ended March 2018 relate to the 13-week transition period ended March 31, 2018.
Unless otherwise indicated, the following disclosures reflect the Company’s continuing operations, including financial position metrics. Refer to Note 4 to VF’s consolidated financial statements included in this report for additional information regarding discontinued operations.
This selected financial data should be read in conjunction with “Management’s Discussion and Analysis of Financial Condition and Results of Operations” and VF’s consolidated financial statements and accompanying notes included in this report. Historical results presented herein may not be indicative of future results.
|
| | | | | | | | | | | | | | | | | | | | | | | | | | |
(Dollars and shares in thousands, except per share amounts) | | | Year Ended March | | | Three Months Ended March (Transition Period) | | Year Ended December |
| | 2019 | | | 2018 | | 2017 | | 2016 | | 2015 | | 2014 |
SUMMARY OF OPERATIONS (1) | | | | | | | | | | | | | | |
Total revenues | | | $ | 13,848,660 |
| | | $ | 3,045,446 |
| | $ | 11,811,177 |
| | $ | 11,026,147 |
| | $ | 10,996,393 |
| | $ | 10,831,889 |
|
Operating income (2) | | | 1,675,840 |
| | | 310,065 |
| | 1,513,029 |
| | 1,455,458 |
| | 1,680,419 |
| | 1,697,172 |
|
Income from continuing operations | | | 1,259,004 |
| | | 261,164 |
| | 721,209 |
| | 1,078,854 |
| | 1,217,056 |
| | 1,233,711 |
|
Earnings per common share from continuing operations – basic | | | $ | 3.19 |
| | | $ | 0.66 |
| | $ | 1.81 |
| | $ | 2.59 |
| | $ | 2.86 |
| | $ | 2.85 |
|
Earnings per common share from continuing operations – diluted | | | 3.14 |
| | | 0.65 |
| | 1.79 |
| | 2.56 |
| | 2.82 |
| | 2.80 |
|
Dividends per share | | | 1.9400 |
| | | 0.4600 |
| | 1.7200 |
| | 1.5300 |
| | 1.3300 |
| | 1.1075 |
|
Dividend payout ratio (3) | | | 61.7 | % | | | 70.7 | % | | 96.2 | % | | 59.9 | % | | 47.2 | % | | 39.5 | % |
FINANCIAL POSITION (4) | | | | | | | | | | | | | | |
Working capital | | | $ | 2,011,853 |
| | | $ | 1,256,941 |
| | $ | 1,353,983 |
| | $ | 2,378,198 |
| | $ | 2,033,498 |
| | $ | 2,215,491 |
|
Current ratio | | | 1.8 |
| | | 1.4 |
| | 1.5 |
| | 2.4 |
| | 2.1 |
| | 2.5 |
|
Total assets | | | $ | 10,356,785 |
| | | $ | 9,937,730 |
| | $ | 9,577,802 |
| | $ | 9,015,694 |
| | $ | 8,600,426 |
| | $ | 8,611,545 |
|
Long-term debt, less current maturities | | | 2,115,884 |
| | | 2,212,555 |
| | 2,187,789 |
| | 2,039,180 |
| | 1,401,820 |
| | 1,403,919 |
|
Stockholders’ equity | | | 4,298,516 |
| | | 3,688,096 |
| | 3,719,900 |
| | 4,940,921 |
| | 5,384,838 |
| | 5,630,882 |
|
Debt to total capital ratio (5) | | | 39.3 | % | | | 50.4 | % | | 44.0 | % | | 31.9 | % | | 25.6 | % | | 20.2 | % |
Weighted average common shares outstanding | | | 395,189 |
| | | 395,253 |
| | 399,223 |
| | 416,103 |
| | 425,408 |
| | 432,611 |
|
Book value per common share | | | $ | 10.83 |
| | | $ | 9.35 |
| | $ | 9.40 |
| | $ | 11.93 |
| | $ | 12.62 |
| | $ | 13.01 |
|
OTHER STATISTICS | | | | | | | | | | | | | | |
Operating margin | | | 12.1 | % | | | 10.2 | % | | 12.8 | % | | 13.2 | % | | 15.3 | % | | 15.7 | % |
Return on invested capital (6) (7) | | | 18.2 | % | | | 4.0 | % | | 10.5 | % | | 15.4 | % | | 17.1 | % | | 17.1 | % |
Return on average stockholders’ equity (6) | | | 33.3 | % | | | 7.4 | % | | 18.9 | % | | 23.8 | % | | 25.3 | % | | 22.5 | % |
Return on average total assets (6) | | | 12.7 | % | | | 2.8 | % | | 8.2 | % | | 12.7 | % | | 14.4 | % | | 14.8 | % |
Cash provided (used) by operations (8) | | | $ | 1,664,223 |
| | | $ | (243,223 | ) | | $ | 1,474,660 |
| | $ | 1,480,568 |
| | $ | 1,203,616 |
| | $ | 1,761,841 |
|
Cash dividends paid | | | 767,061 |
| | | 181,373 |
| | 684,679 |
| | 635,994 |
| | 565,275 |
| | 478,933 |
|
| |
(1) | VF recorded non-operating losses on sale related to the divestitures of the Reef® brand business and Van Moer business, totaling $36.8 million in the year ended March 2019. The losses impacted after-tax income from operations by $33.1 million, basic earnings per share by $0.08 and diluted earnings per share by $0.08. Operating results for the year ended March 2019 include costs associated with the relocation of VF's global headquarters and certain brands to Denver, Colorado and separation and related expenses associated with the planned spin-off of the Jeans business. The costs impacted pretax operating income by $158.9 million, after-tax income from continuing operations by $120.0 million, basic earnings per share by $0.30 and diluted earnings per share by $0.30. VF recorded a $465.5 million provisional tax charge in December 2017 related to the transitional impact of the Tax Act. The charge impacted basic earnings per share by $1.17 and diluted earnings per share by $1.15. Operating results for the year ended December 2016 include charges for the impairment of goodwill and intangible assets and pension settlement. The charges impacted pretax operating income by $130.5 million, after-tax income from continuing operations by $95.5 million, basic earnings per share by $0.23 and diluted earnings per share by $0.23. |
VF Corporation Fiscal 2019 Form 10-K 21
| |
(2) | Reflects adoption of accounting standards update 2017-07, "Compensation - Retirement Benefits (Topic 715): Improving the Presentation of Net Periodic Pension Cost and Net Periodic Postretirement Benefit Cost" and the restatement of prior periods to conform to current year presentation. For the years ended December 2017, 2016, 2015 and 2014, operating income increased and other income (expense), net decreased by $9.9 million, $87.2 million, $35.6 million and $33.8 million, respectively. In the three months ended March 2018, operating income decreased and other income (expense), net increased by $1.3 million. |
| |
(3) | Dividend payout ratio is defined as dividends per share divided by earnings per diluted share. |
| |
(4) | VF early adopted the accounting standards update regarding intra-entity transfers in the first quarter of 2017, which resulted in a cumulative adjustment to retained earnings and reduction in other assets in the Consolidated Balance Sheet at January 1, 2017 of $237.8 million. VF adopted the accounting standards update regarding revenue recognition on April 1, 2018, which resulted in a cumulative adjustment to increase retained earnings by $2.0 million and had a material impact to the Consolidated Balance Sheet due to reclassifications of certain customer-related balances. Refer to Note 1 to VF’s consolidated financial statements for additional information. |
| |
(5) | Total capital is defined as stockholders’ equity plus short-term and long-term debt. |
| |
(6) | The numerator in the return calculations is defined as income from continuing operations plus total interest income/expense, net of taxes. |
| |
(7) | Invested capital is defined as average stockholders’ equity plus average short-term and long-term debt. |
| |
(8) | The cash flows related to discontinued operations have not been segregated, and are included in the Consolidated Statements of Cash Flows. Accordingly, the information includes the results of continuing and discontinued operations. |
|
|
ITEM 7. MANAGEMENT’S DISCUSSION AND ANALYSIS OF FINANCIAL CONDITION AND RESULTS OF OPERATIONS. |
VF Corporation (together with its subsidiaries, collectively known as “VF” or the "Company”) is a global leader in the design, production, procurement, marketing and distribution of branded lifestyle apparel, footwear and related products. VF’s diverse portfolio meets consumer needs across a broad spectrum of activities and lifestyles. Our long-term growth strategy is focused on four drivers — reshape our portfolio, transform our model, elevate direct-to-consumer and distort Asia.
VF is diversified across brands, product categories, channels of distribution, geographies and consumer demographics. We own a broad portfolio of brands in the outerwear, footwear, denim,
backpack, luggage, accessory and apparel categories. Our products are marketed to consumers shopping in specialty stores, department stores, national chains, mass merchants, independently-operated partnership stores and with strategic digital partners, and our own direct-to-consumer operations, which includes VF-operated stores, concession retail stores and brand e-commerce sites.
VF is organized by groupings of businesses represented by its reportable segments for financial reporting purposes. The four reportable segments are Outdoor, Active, Work and Jeans.
VF changed to a 52/53 week fiscal year ending on the Saturday closest to March 31 of each year. VF previously used a 52/53 week fiscal year ending on the Saturday closest to December 31 of each year. All references to the years ended March 2019 ("2019"), December 2017 ("2017") and December 2016 ("2016") relate to the 52-week fiscal years ended March 30, 2019, December 30, 2017 and December 31, 2016, respectively. All references to the three months ended March 2018 and March 2017 relate to the 13-week transition period ended March 31, 2018 and the comparable 13-week period ended April 1, 2017, respectively. All references to the twelve months ended March 2018 ("2018") relate to the 52-week period ended March 31, 2018. This period, when presented in comparison to our results for the year ended March 2019, is provided as we believe this comparison is more meaningful to our reader's understanding of our Fiscal 2019 results of operations than a comparison to the year ended December 2017. The unaudited Condensed Consolidated Statements of Income and Condensed Consolidated Statements of Cash Flows for the twelve months ended March 2018 and the three months ended March 2017 are presented at the end of the "Analysis of Results of Operations" section below for reference in the comparisons to the year ended March 2019 and the three months ended March 2018, respectively. The results for the twelve months ended March 2018 and the three months ended March 2017 are unaudited.
All per share amounts are presented on a diluted basis. All percentages shown in the tables below and the discussion that follows have been calculated using unrounded numbers.
References to the year ended March 2019 foreign currency amounts below reflect the changes in foreign exchange rates from the twelve months ended March 2018 and their impact on translating foreign currencies into U.S. dollars and on foreign currency-denominated transactions in countries with highly inflationary economies. References to the year ended December 2017 foreign currency amounts below reflect the changes in foreign exchange rates from the year ended December 2016 and their impact on both translating foreign currencies into U.S. dollars and on transactions denominated in a foreign currency. References to the three months ended March 2018 foreign currency amounts below reflect the changes in foreign exchange rates from the three months ended March 2017 and their impact on both translating foreign currencies into U.S. dollars and on transactions denominated in a foreign currency. VF’s most significant foreign currency exposure relates to business conducted in euro-based countries. Additionally, VF conducts business in other developed and emerging markets around the world with exposure to foreign currencies other than the euro, such as Argentina, which is a highly inflationary economy.
In light of the recently completed portfolio management actions and organizational realignments, the Company realigned its
22 VF Corporation Fiscal 2019 Form 10-K
internal reporting structure to reflect the organizational changes to better support and assess the operations of the business. The chief operating decision maker allocates resources and assesses performance based on a global brand view with the new reportable segments: Outdoor, Active, Work and Jeans. In the tables below, the Company has recast historical financial information to reflect the new reportable segments. These changes had no impact on previously reported consolidated results of operations. Refer to additional discussion in the “Information by Reportable Segment” section below and Note 19 to VF's consolidated financial statements.
On October 2, 2017, VF acquired 100% of the outstanding shares of Williamson-Dickie Mfg. Co. ("Williamson-Dickie") and the business results have been included in the Work segment. On April 3, 2018, VF acquired 100% of the stock of Icebreaker Holdings Limited ("Icebreaker"). On June 1, 2018, VF acquired 100% of the stock of Icon-Altra LLC, plus certain assets in Europe ("Altra"). The business results for Icebreaker and Altra have been included in the Outdoor segment. All references to contributions from acquisitions below represent the operating results of Williamson-Dickie through the one-year anniversary of the acquisition and the operating results of Icebreaker and Altra from their respective dates of acquisition. Refer to Note 3 to VF's consolidated financial statements for additional information on acquisitions.
On October 5, 2018, VF completed the sale of the Van Moer business, which was included in the Work segment. On October 26, 2018, VF completed the sale of the Reef® brand business, which was included in the Active segment. All references to dispositions
below represent the impact of operating results of the Reef® brand and the Van Moer business, beginning in the period of disposition.
The Nautica® brand business, the Licensing Business (which comprised the Licensed Sports Group and JanSport® brand collegiate businesses), and the former Contemporary Brands segment have been reported as discontinued operations in our Consolidated Statements of Income, and the related held-for-sale assets and liabilities have been presented as assets and liabilities of discontinued operations in the Consolidated Balance Sheets, through their respective dates of disposal. Unless otherwise noted, amounts, percentages and discussion for all periods included below reflect the results of operations and financial condition from VF’s continuing operations.
On August 13, 2018, VF announced its intention to spin-off its Jeans business, which includes the Wrangler®, Lee® and Rock & Republic® brands, as well as the VF Outlet™ business. The spin-off creates two independent, publicly traded companies. The transaction is expected to be tax-free to VF and its shareholders and is effected through a pro-rata distribution of the new company’s stock to existing VF shareholders whereby each VF shareholder will receive one share of the new company's stock for every seven shares of VF stock held on the record date. The spin-off, which was completed after March 30, 2019 on May 22, 2019, is not reflected in our historical financial statements.
Refer to Note 4 to VF’s consolidated financial statements for additional information on discontinued operations and other divestitures.
|
|
HIGHLIGHTS OF THE YEAR ENDED MARCH 2019 |
| |
• | Year ended March 2019 revenues were up 12% to $13.8 billion compared to the twelve months ended March 2018, primarily due to the $1.0 billion contribution from organic growth and a $696.3 million contribution from acquisitions, including a 1% unfavorable impact from foreign currency. |
| |
• | Active segment revenues increased 16% over the twelve months ended March 2018 to $4.7 billion, including a 2% unfavorable impact from foreign currency. |
| |
• | Outdoor segment revenues increased 9% over the twelve months ended March 2018 to $4.6 billion, including a $224.4 million contribution from acquisitions and a 1% unfavorable impact from foreign currency. |
| |
• | Direct-to-consumer revenues increased 14% over the twelve months ended March 2018, including a 1% unfavorable impact from foreign currency and a 3-percentage point contribution from acquisitions. Direct-to-consumer revenues accounted for 33% of VF’s total revenues in the year ended March 2019. VF opened 110 retail stores in the year ended March 2019. E-commerce revenues increased 32% in the year ended March 2019 compared to the twelve months ended March 2018, including a 1% unfavorable impact from foreign currency and a 9-percentage point contribution from acquisitions. |
| |
• | International revenues increased 10% over the twelve months ended March 2018, including a 3% unfavorable impact from foreign currency and a 6-percentage point contribution from acquisitions. International revenues represented 41% of VF’s total revenues in the year ended March 2019. |
| |
• | Gross margin increased 10 basis points to 50.7% in the year ended March 2019 compared to the twelve months ended March 2018, reflecting benefits from a mix-shift to higher margin businesses and increased pricing, partially offset by costs related to the acquisition, integration and separation of businesses and certain increases in product costs. |
| |
• | Cash flow from operations was $1.7 billion in the year ended March 2019. |
| |
• | Earnings per share increased 63% to $3.14 in the year ended March 2019 from $1.92 in the twelve months ended March 2018. The twelve months ended March 2018 included a $1.15 negative transitional impact from the enactment of the Tax Cuts and Jobs Act ("Tax Act") compared to a $0.09 negative impact in the year ended March 2019 due to adjustments on provisional amounts recorded. The increase was also driven by organic growth in the Active, Outdoor and Work segments, continued strength in our direct-to-consumer and international businesses and contributions from acquisitions. These improvements were partially offset by expenses related to the acquisition, integration and separation of businesses, costs related to relocation and other strategic business decisions and declines in the Jeans segment. |
| |
• | VF increased the quarterly dividend rate by 11% in the year ended March 2019, marking the 46th consecutive year of increase in the rate of dividends paid per share. |
| |
• | VF repurchased $150.7 million of its Common Stock and paid $767.1 million in cash dividends, returning $917.8 million to stockholders. |
VF Corporation Fiscal 2019 Form 10-K 23
|
|
ANALYSIS OF RESULTS OF OPERATIONS |
|
|
Consolidated Statements of Income |
The following table presents a summary of the changes in net revenues for the year ended March 2019 compared to the twelve months ended March 2018 and the year ended December 2017 compared to the year ended December 2016:
|
| | | | | | | | | |
(In millions) | | Year Ended March 2019 Compared to Twelve Months Ended March 2018 (unaudited) | | | Year Ended December 2017 Compared to Year Ended December 2016 |
Net revenues — prior period | | $ | 12,356.3 |
| | | $ | 11,026.1 |
|
Organic growth | | 1,039.0 |
| | | 489.3 |
|
Acquisitions | | 696.3 |
| | | 247.2 |
|
Dispositions | | (89.0 | ) | | | — |
|
Impact of foreign currency | | (153.9 | ) | | | 48.6 |
|
Net revenues — current period | | $ | 13,848.7 |
| | | $ | 11,811.2 |
|
Year Ended March 2019 Compared to Twelve Months Ended March 2018 (unaudited)
VF reported a 12% increase in revenues in 2019. The 2019 results were driven by organic growth in the Active, Outdoor and Work segments, continued strength in our direct-to-consumer and international businesses and contributions from acquisitions. The increases were partially offset by an unfavorable impact from foreign currency, lower revenues due to dispositions and declines in the Jeans segment. International sales grew in every region in 2019.
Year Ended December 2017 Compared to Year Ended December 2016
VF reported a 7% increase in revenues in 2017. The 2017 results were driven by increases in the Active and Outdoor segments and continued strength in our direct-to-consumer and international businesses. The increase was also attributable to growth in the Work segment, which included a $247.2 million contribution from the Williamson-Dickie acquisition, which closed on October 2, 2017. These increases were offset by declines in the Jeans segment. International sales grew in every region in 2017.
Additional details on revenues are provided in the section titled “Information by Reportable Segment”.
The following table presents the percentage relationship to net revenues for components of the Consolidated Statements of Income:
|
| | | | | | | | | | | | | |
| | Year Ended March 2019 | | | Twelve Months Ended March 2018 (unaudited) | | Year Ended December |
| | | | | 2017 | | 2016 |
Gross margin (net revenues less cost of goods sold) | | 50.7 | % | | | 50.6 | % | | 50.5 | % | | 49.3 | % |
Selling, general and administrative expenses | | 38.6 |
| | | 38.2 |
| | 37.7 |
| | 35.4 |
|
Impairment of goodwill and intangible assets | | — |
| | | — |
| | — |
| | 0.7 |
|
Operating income | | 12.1 | % | | | 12.4 | % | | 12.8 | % | | 13.2 | % |
Year Ended March 2019 Compared to Twelve Months Ended March 2018 (unaudited)
Gross margin increased 10 basis points to 50.7% in 2019 compared to 50.6% in 2018. Gross margin in 2019 was positively impacted by a mix-shift to higher margin businesses and increased pricing, partially offset by $45.9 million of costs related to the acquisition, integration and separation of businesses, and costs related to the relocation of our global headquarters and certain brands to Denver, Colorado.
Selling, general and administrative expenses as a percentage of total revenues increased 40 basis points in 2019 compared to 2018. This increase is primarily due to $186.7 million of expenses related to the acquisition, integration and separation of businesses, and relocation of our global headquarters and certain brands to Denver, Colorado. The increase is also due to continued investments in our key strategic growth initiatives. These costs were partially offset by leverage of operating expenses on higher revenues.
In 2019, operating margin decreased 30 basis points, to 12.1% from 12.4% in 2018, primarily due to the items described above.
Net interest expense decreased $1.4 million to $85.4 million in 2019. The decrease in net interest expense was due to higher
international bank balances in high yielding currencies and the payoff of the $250.0 million of 5.95% fixed-rate notes on November 1, 2017, which was partially offset by higher interest rates on increased levels of short-term borrowings.
Outstanding interest-bearing debt averaged $3.4 billion for both 2019 and 2018, with short-term borrowings representing 35.3% and 30.9% of average debt outstanding for the respective years. The weighted average interest rates on outstanding debt were 3.1% in 2019 and 2.9% in 2018.
Other income (expense), net primarily consists of foreign currency gains and losses, the funding fee charged on the sale of our trade receivables, other components of net periodic pension cost (excluding the service cost component) and non-operating gains and losses. Other income (expense) netted to $(63.0) million and $(1.8) million in 2019 and 2018, respectively. Included in other income (expense), net in 2019 is the loss on sale of the Reef® brand business of $14.4 million and loss on sale of $22.4 million related to the divestiture of the Van Moer business.
The effective income tax rate was 17.6% in 2019 compared to 46.6% in 2018. The effective income tax rate is substantially lower in 2019 when compared to 2018 primarily due to discrete tax expense
24 VF Corporation Fiscal 2019 Form 10-K
associated with the Tax Act. In December 2017, VF recognized a provisional charge of approximately $465.5 million to reflect the impacts resulting from the Tax Act, primarily comprised of approximately $512.4 million related to the transition tax and approximately $89.5 million of tax benefits related to revaluing U.S. deferred tax assets and liabilities using the new U.S. corporate tax rate of 21%. Other provisional charges of $42.6 million were primarily related to U.S. federal and state tax on foreign income and dividends and establishing a deferred tax liability for foreign withholding taxes as the Company is not asserting indefinite reinvestment on short-term liquid assets of certain foreign subsidiaries. All other foreign earnings, including basis differences of certain foreign subsidiaries, continue to be considered indefinitely reinvested.
The 2019 effective income tax rate included a net discrete tax expense of $18.9 million, which included $37.3 million net tax expense related to adjustments to provisional amounts recorded in 2017 under the Tax Act, $31.9 million of tax benefit related to stock compensation, $14.3 million of net tax expense related to unrecognized tax benefits and interest, $1.9 million of tax benefit related to adjustments of previously recorded amounts based on proposed regulations, and $1.2 million of tax expense related to adjustments to previously recognized state income tax credits. The $18.9 million net discrete tax expense in 2019 increased the effective income tax rate by 1.3% compared to an unfavorable 29.4% impact of discrete items for 2018. Excluding discrete items, the effective tax rate during 2019 decreased by approximately 0.9% primarily due to a lower US corporate income tax rate that was effective beginning January 1, 2018. The international effective tax rate was 11.6% for 2019.
As a result of the above, income from continuing operations in 2019 was $1.3 billion ($3.14 per diluted share), compared to $0.8 billion ($1.92 per diluted share) in 2018.
Refer to additional discussion in the “Information by Reportable Segment” section below.
Year Ended December 2017 Compared to Year Ended December 2016
Gross margin improved 120 basis points to 50.5% in 2017 compared to 49.3% in 2016, reflecting a 180 basis point benefit from pricing, a mix-shift toward higher margin businesses and lower restructuring costs, which was partially offset by an unfavorable 60 basis point impact from foreign currency.
Selling, general and administrative expenses as a percentage of total revenues increased 230 basis points in 2017 compared to 2016. This increase is primarily due to investments in our key growth priorities, which include direct-to-consumer, product innovation, demand creation and technology initiatives. The increases were partially offset by lower restructuring costs in 2017.
In 2017, operating margin decreased 40 basis points, to 12.8% from 13.2% in 2016. In addition to the items described above, the operating margin decrease was partially offset by a 70 basis point increase from goodwill and intangible asset impairments in 2016 that did not recur in 2017.
Net interest expense increased $0.3 million to $85.9 million in 2017. The increase in net interest expense was due to higher interest rates on short-term borrowings and higher interest on long-term debt balances due to a full year of interest on the €850 million euro-denominated 0.625% fixed-rate notes issued in September 2016, which were partially offset by the payoff of the $250.0 million of 5.95% fixed-rate notes on November 1, 2017 and an increase in international short-term investment rates.
Outstanding interest-bearing debt averaged $3.2 billion for 2017 compared to $2.6 billion for 2016, with short-term borrowings representing 27% and 37% of average debt outstanding for the respective years. The weighted average interest rates on outstanding debt were 3.1% in 2017 and 3.5% in 2016, as the impact of the issuance of €850 million euro-denominated 0.625% fixed-rate notes in September of 2016 was offset by higher short-term debt rates.
Other income (expense), net primarily consists of foreign currency gains and losses, the funding fee charged on the sale of our trade receivables, other components of net periodic pension cost (excluding the service cost component) and non-operating gains and losses. Other income (expense) netted to $(10.7) million and $(85.2) million in 2017 and 2016, respectively. A pension settlement charge of $50.9 million was included in 2016, which did not recur in 2017.
The effective income tax rate was 49.1% in 2017 compared to 16.0% in 2016. The effective income tax rate is substantially higher in 2017 when compared to 2016 primarily due to discrete tax expense associated with the Tax Act. The Tax Act reduces the federal tax rate on U.S. earnings to 21% and moves from a global taxation regime to a modified territorial regime. As part of the legislation, U.S. companies are required to pay a tax on historical earnings generated offshore that have not been repatriated to the U.S. Additionally, revaluation of deferred tax asset and liability positions at the lower federal base rate of 21% is also required. The transitional impact of the Tax Act resulted in a provisional net charge of $465.5 million, or $1.15 per share, during the three months ended December 2017. This amount, which is included in the income taxes line item in the Consolidated Statements of Income, is primarily comprised of approximately $512.4 million related to the transition tax and approximately $89.5 million tax benefit related to revaluing U.S. deferred tax assets and liabilities using the new U.S. corporate tax rate of 21%. Other provisional charges of $42.6 million were primarily related to U.S. federal and state tax on foreign income and dividends and establishing a deferred tax liability for foreign withholding taxes as the Company is not asserting indefinite reinvestment on short-term liquid assets of certain foreign subsidiaries. All other foreign earnings, including basis differences of certain foreign subsidiaries, continue to be considered indefinitely reinvested.
The 2017 effective income tax rate included a net discrete tax expense of $438.9 million, which included the provisional net charge of $465.5 million related to the Tax Act, $25.2 million of tax benefits related to stock compensation, $2.9 million of net tax benefit related to the realization of previously unrecognized tax benefits and interest, and $1.9 million of discrete tax expense related to the effects of tax rate changes, exclusive of the Tax Act. The $438.9 million net discrete tax expense in 2017 increased the effective income tax rate by 31.0% compared to a favorable 3.4% impact of discrete items in 2016. Without discrete items, the effective tax rate during 2017 decreased by approximately 1.3% primarily due to the negative tax impact related to the 2016 goodwill impairment. The international effective tax rate was 13.1% and 10.9% for 2017 and 2016, respectively.
As a result of the above, income from continuing operations in 2017 was $0.7 billion ($1.79 per diluted share), compared to $1.1 billion ($2.56 per diluted share) in 2016.
Refer to additional discussion in the “Information by Reportable Segment” section below.
VF Corporation Fiscal 2019 Form 10-K 25
Transition Period Three Months Ended March 2018 Compared to Three Months Ended March 2017 (unaudited)
The following table presents a summary of the changes in net revenues from the comparable period in 2017:
|
| | | |
(In millions) | Three Months Ended March |
Net revenues — 2017 | $ | 2,500.3 |
|
Organic growth | 191.6 |
|
Acquisitions | 233.1 |
|
Impact of foreign currency | 120.4 |
|
Net revenues — 2018 | $ | 3,045.4 |
|
VF reported a 22% increase in revenues for the three months ended March 2018 compared to the 2017 period. The revenue increase was attributable to the Williamson-Dickie acquisition, organic growth in the Active segment and continued strength in our direct-to-consumer and international businesses. These increases were partially offset by declines in the Jeans segment. Excluding the
impacts from foreign currency, international sales grew in every region in the three months ended March 2018.
Additional details on revenues are provided in the section titled “Information by Reportable Segment”.
The following table presents the percentage relationship to net revenues for components of the Consolidated Statements of Income:
|
| | | | | |
| Three Months Ended March |
| 2018 | | 2017 (unaudited) |
Gross margin (net revenues less cost of goods sold) | 50.5 | % | | 50.3 | % |
Selling, general and administrative expenses | 40.4 |
| | 38.5 |
|
Operating income | 10.2 | % | | 11.7 | % |
Gross margin increased 20 basis points in the three months ended March 2018 compared to the 2017 period. Gross margin was favorably impacted by increases in pricing, a mix-shift to higher margin businesses in the Outdoor and Active segments, and foreign currency changes, offset by lower margins attributable to the Williamson-Dickie acquisition and certain increases in product costs.
Selling, general and administrative expenses as a percentage of total revenues increased 190 basis points during the three months ended March 2018 compared to the 2017 period. The increase was due to expenses related to the acquisition and integration of businesses and higher investments in our key growth priorities, which include demand creation, customer fulfillment, direct-to-consumer and product innovation. Higher compensation costs also impacted the three months ended March 2018.
Net interest expense increased $1.0 million during the three months ended March 2018 compared to the 2017 period. This increase was due to higher levels of short-term borrowings at higher interest rates compared to 2017, which was partially offset by lower interest on long-term debt due to the payoff of the $250.0 million of 5.95% fixed-rate notes on November 1, 2017. Total outstanding debt averaged $3.2 billion in the three months ended March 2018 and $2.6 billion in the same period in 2017, with weighted average interest rates of 2.9% and 3.6%, respectively.
The effective income tax rate for the three months ended March 2018 was 11.2% compared to 20.8% in the three months ended
March 2017. The three months ended March 2018 included a net discrete tax benefit of $16.1 million, which included a $12.1 million tax benefit related to stock compensation, a $7.3 million net tax benefit related to the realization of previously unrecognized tax benefits and interest, an $8.8 million tax expense related to the change of a prior estimate of taxes payable, and a $5.1 million net tax benefit related to adjustments to provisional amounts recorded in 2017 under the Tax Act. The $16.1 million net discrete tax benefit in the three months ended March 2018 reduced the effective income tax rate by 5.5% compared to a favorable 0.4% impact of discrete items in the three months ended March 2017. Without discrete items, the effective income tax rate for the three months ended March 2018 decreased by 4.5% compared with the estimated annual effective tax rate applied to the three months ended March 2017 primarily due to a higher percentage of income in lower tax rate jurisdictions, partially offset by an unfavorable impact from the Tax Act.
As a result of the above, net income in the three months ended March 2018 was $261.2 million ($0.65 per share) compared to $213.3 million ($0.51 per share) in the 2017 period.
Refer to additional discussion in the “Information by Reportable Segment” section below.
26 VF Corporation Fiscal 2019 Form 10-K
|
|
Information by Reportable Segment |
As discussed above, VF realigned its internal reporting structure in Fiscal 2019 to reflect organizational changes to better support and assess the operations of the business. The new reportable segments are: Outdoor, Active, Work and Jeans. We have included an other category in the tables below for purposes of reconciliation of revenues and profit, but it is not considered a reportable segment. The Company has recast historical financial information to reflect the new reportable segments. These changes had no impact on previously reported consolidated results of operations.
The primary financial measures used by management to evaluate the financial results of VF's reportable segments are segment revenues and segment profit. Segment profit comprises the operating income and other income (expense), net line items of each segment.
Refer to Note 19 to the consolidated financial statements for a summary of results of operations by segment, along with a reconciliation of segment profit to income before income taxes.
Year Ended March 2019 Compared to Twelve Months Ended March 2018 (unaudited) and Year Ended December 2017 Compared to Year Ended December 2016
The following tables present a summary of the changes in segment revenues and profit in the year ended March 2019 compared to the twelve months ended March 2018 and the year ended December 2017 compared to the year ended December 2016:
|
| | | | | | | | | | | | | | | | | | | | | | | | |
Segment Revenues: | | | | | | | | | | | | |
| Year Ended March 2019 Compared to Twelve Months Ended March 2018 (unaudited) | |
(In millions) | Outdoor | | Active | | Work | | Jeans | | Other | | Total | |
Segment revenues — Twelve Months Ended March 2018 (unaudited) | $ | 4,261.9 |
| | $ | 4,054.5 |
| | $ | 1,342.0 |
| | $ | 2,586.6 |
| | $ | 111.3 |
| | $ | 12,356.3 |
| |
Organic growth | 222.2 |
| | 776.0 |
| | 79.4 |
| | (51.4 | ) | | 12.8 |
| | 1,039.0 |
| |
Acquisitions | 224.4 |
| | — |
| | 471.9 |
| | — |
| | — |
| | 696.3 |
| |
Dispositions | — |
| | (64.4 | ) | | (24.6 | ) | | — |
| | — |
| | (89.0 | ) | |
Impact of foreign currency | (59.5 | ) | | (44.3 | ) | | (6.7 | ) | | (43.4 | ) | | — |
| | (153.9 | ) | |
Segment revenues — Year Ended March 2019 | $ | 4,649.0 |
| | $ | 4,721.8 |
| | $ | 1,862.0 |
| | $ | 2,491.8 |
| | $ | 124.1 |
| | $ | 13,848.7 |
| |
| | |
| Year Ended December 2017 Compared to Year Ended December 2016 | |
(In millions) | Outdoor | | Active | | Work | | Jeans | | Other | | Total | |
Segment revenues — Year Ended December 2016 | $ | 4,123.4 |
| | $ | 3,318.4 |
| | $ | 776.2 |
| | $ | 2,690.1 |
| | $ | 118.0 |
| | $ | 11,026.1 |
| |
Organic growth | 54.3 |
| | 459.6 |
| | 75.1 |
| | (94.9 | ) | | (4.8 | ) | | 489.3 |
| |
Acquisition | — |
| | — |
| | 247.2 |
| | — |
| | — |
| | 247.2 |
| |
Impact of foreign currency | 31.3 |
| | 13.7 |
| | 1.2 |
| | 2.4 |
| | — |
| | 48.6 |
| |
Segment revenues — Year Ended December 2017 | $ | 4,209.0 |
| | $ | 3,791.7 |
| | $ | 1,099.7 |
| | $ | 2,597.6 |
| | $ | 113.2 |
| | $ | 11,811.2 |
| |
| | | | | | | | | | | | |
Segment Profit: | | | | | | | | | | | | |
| Year Ended March 2019 Compared to Twelve Months Ended March 2018 (unaudited) | |
(In millions) | Outdoor | | Active | | Work | | Jeans | | Other | | Total | |
Segment profit — Twelve Months Ended March 2018 (unaudited) | $ | 508.8 |
| | $ | 894.2 |
| | $ | 166.0 |
| | $ | 395.8 |
| | $ | (4.0 | ) | | $ | 1,960.8 |
| |
Organic growth | 27.1 |
| | 247.3 |
| | 17.0 |
| | (109.3 | ) | | 4.5 |
| | 186.6 |
| |
Acquisitions | 21.1 |
| | — |
| | 39.7 |
| | — |
| | — |
| | 60.8 |
| |
Dispositions | — |
| | (9.6 | ) | | (1.4 | ) | | — |
| | — |
| | (11.0 | ) | |
Impact of foreign currency | (12.6 | ) | | (6.2 | ) | | (0.6 | ) | | 14.0 |
| | — |
| | (5.4 | ) | |
Segment profit — Year Ended March 2019 | $ | 544.4 |
| | $ | 1,125.7 |
| | $ | 220.7 |
| | $ | 300.5 |
| | $ | 0.5 |
| | $ | 2,191.8 |
| |
| | |
| Year Ended December 2017 Compared to Year Ended December 2016 | |
(In millions) | Outdoor | | Active | | Work | | Jeans | | Other | | Total | |
Segment profit — Year Ended December 2016 | $ | 594.5 |
| | $ | 628.2 |
| | $ | 137.3 |
| | $ | 479.2 |
| | $ | (4.9 | ) | | $ | 1,834.3 |
| |
Organic growth | (35.0 | ) | | 211.8 |
| | 14.2 |
| | (76.6 | ) | | 1.9 |
| | 116.3 |
| |
Acquisition | — |
| | — |
| | 11.0 |
| | — |
| | — |
| | 11.0 |
| |
Impact of foreign currency | (22.0 | ) | | (34.2 | ) | | 1.1 |
| | 3.9 |
| | — |
| | (51.2 | ) | |
Segment profit — Year Ended December 2017 | $ | 537.5 |
| | $ | 805.8 |
| | $ | 163.6 |
| | $ | 406.5 |
| | $ | (3.0 | ) | | $ | 1,910.4 |
| |
VF Corporation Fiscal 2019 Form 10-K 27
Transition Period Three Months Ended March 2018 Compared to Three Months Ended March 2017 (unaudited)
The following tables present a summary of the changes in segment revenues and profit in the three months ended March 2018 from the comparable period in 2017:
|
| | | | | | | | | | | | | | | | | | | | | | | |
Segment Revenues: | | | | | | | | | | | |
| Three Months Ended March 2018 Compared to Three Months Ended March 2017 (unaudited) |
(In millions) | Outdoor | | Active | | Work | | Jeans | | Other | | Total |
Segment revenues — Three Months Ended March 2017 (unaudited) | $ | 835.1 |
| | $ | 808.8 |
| | $ | 200.0 |
| | $ | 634.3 |
| | $ | 22.1 |
| | $ | 2,500.3 |
|
Organic growth | 7.1 |
| | 208.9 |
| | 8.5 |
| | (31.0 | ) | | (1.9 | ) | | 191.6 |
|
Acquisition | — |
| | — |
| | 233.1 |
| | — |
| | — |
| | 233.1 |
|
Impact of foreign currency | 45.8 |
| | 53.9 |
| | 0.7 |
| | 20.0 |
| | — |
| | 120.4 |
|
Segment revenues — Three Months Ended March 2018 | $ | 888.0 |
| | $ | 1,071.6 |
| | $ | 442.3 |
| | $ | 623.3 |
| | $ | 20.2 |
| | $ | 3,045.4 |
|
| | | | | | | | | | | |
Segment Profit: | | | | | | | | | | | |
| Three Months Ended March 2018 Compared to Three Months Ended March 2017 (unaudited) |
(In millions) | Outdoor | | Active | | Work | | Jeans | | Other | | Total |
Segment profit — Three Months Ended March 2017 (unaudited) | $ | 73.5 |
| | $ | 149.3 |
| | $ | 37.7 |
| | $ | 114.5 |
| | $ | (2.3 | ) | | $ | 372.7 |
|
Organic growth | (29.0 | ) | | 76.0 |
| | (3.4 | ) | | (17.9 | ) | | (0.8 | ) | | 24.9 |
|
Acquisition | — |
| | — |
| | 4.8 |
| | — |
| | — |
| | 4.8 |
|
Impact of foreign currency | 0.2 |
| | 12.3 |
| | 0.9 |
| | 7.2 |
| | — |
| | 20.6 |
|
Segment profit — Three Months Ended March 2018 | $ | 44.7 |
| | $ | 237.6 |
| | $ | 40.0 |
| | $ | 103.8 |
| | $ | (3.1 | ) | | $ | 423.0 |
|
28 VF Corporation Fiscal 2019 Form 10-K
The following sections outline the changes in revenues and profitability by segment. For purposes of this analysis, royalty revenues have been included in the wholesale channel for all periods.
Outdoor
|
| | | | | | | | | | | | | | | | | | | | | | | | | |
| | | | | | | | | | | Year Ended December |
(Dollars in millions) | | Year Ended March 2019 | | | Twelve Months Ended March 2018 (unaudited) | | | Percent Change | | | 2017 | | 2016 | | Percent Change |
Segment revenues | | $ | 4,649.0 |
| | | $ | 4,261.9 |
| | | 9.1 | % | | | $ | 4,209.0 |
| | $ | 4,123.4 |
| | 2.1 | % |
Segment profit | | 544.4 |
| | | 508.8 |
| | | 7.0 | % | | | 537.5 |
| | 594.5 |
| | (9.6 | )% |
Operating margin | | 11.7 | % | | | 11.9 | % | | | | | | 12.8 | % | | 14.4 | % | |
|
The Outdoor segment includes the following brands: The North Face®, Timberland® (excluding Timberland PRO®), Icebreaker®, Smartwool® and Altra®.
Year Ended March 2019 Compared to Twelve Months Ended March 2018 (unaudited)
Global revenues for Outdoor increased 9% in 2019, driven by growth in the wholesale and direct-to-consumer channels, including a 1% unfavorable impact due to foreign currency. Revenues in the Americas region increased 8% in 2019, including a 1% unfavorable impact from foreign currency. Revenues in the Europe region increased 9%, including a 3% unfavorable impact from foreign currency. Revenues in the Asia-Pacific region increased 12% in 2019, with a 2% unfavorable impact from foreign currency. Included in these results are revenues from the Icebreaker acquisition of $174.2 million and revenues from the Altra acquisition of $50.2 million. Excluding revenues from Icebreaker and Altra, Outdoor revenues increased 4% in 2019, including a 1% unfavorable impact from foreign currency.
Global revenues for The North Face® brand increased 9% in 2019, including a 1% unfavorable impact from foreign currency. The increase was due to strong operational growth across all channels and regions, including strong performance in the wholesale channel and growth in the direct-to-consumer channel driven by an expanding e-commerce business, comparable store growth and new store openings.
Global revenues for the Timberland® brand (excluding Timberland PRO®) decreased 1% in 2019, as slight increases in the direct-to-consumer and wholesale channels were more than offset by a 2% unfavorable impact from foreign currency. Increases in the direct-to-consumer channel were driven by growth in the Americas region and China, as well as e-commerce growth across all regions, partially offset by declines across the Europe and Asia-Pacific (excluding China) regions.
Global direct-to-consumer revenues for Outdoor increased 7% in 2019, including a 1% unfavorable impact from foreign currency. Excluding revenues from acquisitions, global direct-to-consumer revenues increased 3%, including a 1% unfavorable impact from foreign currency. The increase was primarily due to a growing e-commerce business across all regions and new store openings. Global wholesale revenues for Outdoor increased 11%, driven by global growth in The North Face® brand and acquisitions, and included a 1% unfavorable impact from foreign currency. Excluding revenues from acquisitions, wholesale revenues increased 4%, including a 2% unfavorable impact from foreign currency. The increase was driven by growth across all regions.
Operating margin decreased 20 basis points in 2019 driven by costs related to the relocation of certain brands to Denver, Colorado, partially offset by leverage of operating expenses on higher revenues.
Year Ended December 2017 Compared to Year Ended December 2016
Global revenues for Outdoor increased 2% in 2017, driven by growth in the direct-to-consumer channel, including a 1% favorable impact from foreign currency. Revenues in the Americas region decreased 4% in 2017, reflecting a 5% decrease in the US, partially offset by 9% growth in the non-U.S. Americas region, which included a 3% favorable impact from foreign currency. Revenues in the Europe region increased 15%, including a 2% favorable impact from foreign currency. Revenues in the Asia-Pacific region increased 1% in 2017 due to foreign currency.
Global revenues for The North Face® brand increased 4% in 2017, as growth in the direct-to-consumer channel, driven by comparable store and e-commerce growth, and a 1% favorable impact from foreign currency, were partially offset by relatively flat wholesale revenues. Global wholesale revenues for The North Face® brand were tempered by U.S. retailer bankruptcies, lower year-over-year off-price shipments and efforts to manage inventory levels in certain markets.
Global revenues for the Timberland® brand (excluding Timberland PRO®) increased 1% in 2017, as growth in the direct-to-consumer channel, driven by comparable store and e-commerce growth, and a 2% favorable impact from foreign currency, were partially offset by declines in the wholesale channel.
Global direct-to-consumer revenues for Outdoor grew 9% in 2017, driven by an expanding e-commerce business, comparable store growth and a 1% favorable impact from foreign currency. Global wholesale revenues for Outdoor decreased 2% in 2017, driven by the above-mentioned U.S. retailer bankruptcies, lower year-over-year off-price shipments and efforts to manage inventory levels in certain markets.
Operating margin decreased 160 basis points in 2017, reflecting increased investments in direct-to-consumer, product and innovation, demand creation and technology, partially offset by gross margin expansion driven by a mix-shift to higher margin businesses, lower product costs and pricing.
VF Corporation Fiscal 2019 Form 10-K 29
Transition Period Three Months Ended March 2018 Compared to Three Months Ended March 2017 (unaudited)
|
| | | | | | | | | | | |
| | Three Months Ended March |
(Dollars in millions) | | 2018 | | 2017 (unaudited) | | Percent
Change |
Segment revenues | | $ | 888.0 |
| | $ | 835.1 |
| | 6.3 | % |
Segment profit | | 44.7 |
| | 73.5 |
| | (39.2 | )% |
Operating margin | | 5.0 | % | | 8.8 | % | | |
Global revenues for Outdoor increased 6% in the three months ended March 2018 compared to 2017, driven by an overall 5% favorable impact due to foreign currency as well as growth in the direct-to-consumer channel, partially offset by a decline in the wholesale channel. Revenues in the Americas region decreased 5% in the three months ended March 2018. Revenues in the Europe region increased 24%, including a 13% favorable impact from foreign currency. Revenues in the Asia-Pacific region increased 5%, with a 6% favorable impact from foreign currency.
Global revenues for The North Face® brand increased 11% in the three months ended March 2018 compared to the 2017 period. The increase in the period was primarily due to growth in the direct-to-consumer channel, driven by comparable store and e-commerce growth, and an overall 4% favorable impact from foreign currency. Increases in the wholesale channel were driven by growth in the Europe region and a favorable foreign currency impact, partially offset by declines in the Americas and Asia-Pacific regions.
Global revenues for the Timberland® brand (excluding Timberland PRO®) increased 5% in the three months ended March 2018 due
to growth in the direct-to-consumer channel, driven by the Europe region, and a 7% favorable impact from foreign currency. The growth in the direct-to-consumer channel was due to comparable store and e-commerce growth, and was more than offset by declines in the wholesale channel.
Global direct-to-consumer revenues for Outdoor grew 18% in the three months ended March 2018 compared to the 2017 period. Growth in the direct-to-consumer channel was driven by an expanding e-commerce business, comparable store growth and a 6% favorable impact from foreign currency. Wholesale revenues decreased 1% in the three months ended March 2018, driven by declines in the Asia-Pacific and Americas regions, partially offset by growth in the Europe region and a 5% favorable impact from foreign currency.
Operating margin decreased 380 basis points in the three months ended March 2018 compared to the 2017 period, primarily due to increased selling, general and administrative investments in direct-to-consumer and demand creation initiatives and higher product costs, partially offset by a mix-shift to higher margin businesses.
30 VF Corporation Fiscal 2019 Form 10-K
Active
|
| | | | | | | | | | | | | | | | | | | | | | | | | |
| | | | | | | | | | | Year Ended December |
(Dollars in millions) | | Year Ended March 2019 | | | Twelve Months Ended March 2018 (unaudited) | | | Percent Change | | | 2017 | | 2016 | | Percent Change |
Segment revenues | | $ | 4,721.8 |
| | | $ | 4,054.5 |
| | | 16.5 | % | | | $ | 3,791.7 |
| | $ | 3,318.4 |
| | 14.3 | % |
Segment profit | | 1,125.7 |
| | | 894.2 |
| | | 25.9 | % | | | 805.8 |
| | 628.2 |
| | 28.3 | % |
Operating margin | | 23.8 | % | | | 22.1 | % | | | | | | 21.3 | % | | 18.9 | % | |
|
The Active segment includes the following brands: Vans®, Kipling®, Napapijri®, Eastpak®, JanSport®, Reef® (through the date of sale) and Eagle Creek®.
Year Ended March 2019 Compared to Twelve Months Ended March 2018 (unaudited)
Global revenues for Active increased 16% in 2019, driven by growth across all channels and regions, including a 2% unfavorable impact from foreign currency. Revenues in the Americas region increased 21% in 2019, including a 1% unfavorable impact from foreign currency. Revenues in the Europe region increased 7%, including a 2% unfavorable impact from foreign currency. Revenues in the Asia-Pacific region increased 17% in 2019, including a 1% unfavorable impact from foreign currency. The year ended March 2019 was negatively impacted by the sale of the Reef® brand business in October 2018, which resulted in lower revenues of $64.4 million. Excluding the impact of this divestiture, revenues increased 18% compared to the 2018 period, including a 1% unfavorable impact from foreign currency.
Vans® brand global revenues increased 24% in 2019, including a 2% unfavorable impact from foreign currency. The increase was due to strong operational growth across all channels and regions, including strong wholesale performance and direct-to-consumer growth driven by an expanding e-commerce business, comparable store growth and new store openings.
Global direct-to-consumer revenues for Active grew 22% in 2019, including a 1% unfavorable impact from foreign currency. Growth in the direct-to-consumer channel was driven by a growing e-commerce business, comparable store growth and new store openings. Global wholesale revenues for Active increased 12% in 2019, driven by global growth in the Vans® brand, and included a 1% unfavorable impact from foreign currency.
Operating margin increased 170 basis points in 2019, reflecting gross margin expansion driven by a mix-shift to higher margin businesses and products, and leverage of operating expenses on higher revenues.
Year Ended December 2017 Compared to Year Ended December 2016
Global revenues for Active increased 14% in 2017, driven by growth in the direct-to-consumer and wholesale channels. Revenues in the Americas region increased 15% in 2017, including a 1% favorable impact from foreign currency. Revenues in the Europe and Asia-Pacific regions each increased 14%, including a 1% favorable impact from foreign currency.
Vans® brand global revenues increased 19% in 2017, reflecting strong operational growth in both the direct-to-consumer and wholesale channels. The growth in the direct-to-consumer channel was driven by strong comparable store and e-commerce growth.
Global direct-to-consumer revenues for Active grew 25% in 2017, driven by an expanding e-commerce business and comparable store growth. Wholesale revenues increased 7% in 2017, including a 1% favorable impact from foreign currency. The increase was driven by growth in the Vans® brand and Europe region.
Operating margin increased 240 basis points in 2017. The increase was due to gross margin expansion driven by a mix-shift to higher margin businesses, pricing and lower product costs, partially offset by increased investments in direct-to-consumer, product and innovation, demand creation and technology.
VF Corporation Fiscal 2019 Form 10-K 31
Transition Period Three Months Ended March 2018 Compared to Three Months Ended March 2017 (unaudited)
|
| | | | | | | | | | | |
| | Three Months Ended March |
(Dollars in millions) | | 2018 | | 2017 (unaudited) | | Percent
Change |
Segment revenues | | $ | 1,071.6 |
| | $ | 808.8 |
| | 32.5 | % |
Segment profit | | 237.6 |
| | 149.3 |
| | 59.2 | % |
Operating margin | | 22.2 | % | | 18.5 | % | | |
Global revenues for Active increased 32% in the three months ended March 2018 compared to 2017, driven by growth in the direct-to-consumer and wholesale channels and an overall 6% favorable impact due to foreign currency. Revenues in the Americas region increased 35% in the three months ended March 2018, including a 1% increase from foreign currency. Revenues in the Europe region increased 33%, including a 15% favorable impact from foreign currency. Revenues in the Asia-Pacific region increased 20%, with a 7% favorable impact from foreign currency.
Vans® brand global revenues increased 45% in the three months ended March 2018 compared to the 2017 period. The increase in the period was due to strong operational growth in both the wholesale and direct-to-consumer channels in all regions, including an overall 6% favorable impact from foreign currency. The growth in the direct-to-consumer channel was driven by strong comparable store and e-commerce growth.
Global direct-to-consumer revenues for Active grew 45% in the three months ended March 2018 compared to the 2017 period. Growth in the direct-to-consumer channel was driven by an expanding e-commerce business, comparable store growth and a 7% favorable impact from foreign currency. Wholesale revenues increased 25% in the three months ended March 2018, driven by global growth in the Vans® brand and broad-based growth across our brands in the Europe region, in addition to a 7% favorable impact from foreign currency.
Operating margin increased 370 basis points in the three months ended March 2018 compared to the 2017 period, reflecting gross margin expansion driven by a mix-shift to higher margin businesses, pricing and lower product costs, partially offset by increased selling, general and administrative investments in direct-to-consumer and demand creation initiatives.
Work
|
| | | | | | | | | | | | | | | | | | | | | | | | | |
| | | | | | | | | | | Year Ended December |
(Dollars in millions) | | Year Ended March 2019 | | | Twelve Months Ended March 2018 (unaudited) | | | Percent Change | | | 2017 | | 2016 | | Percent Change |
Segment revenues | | $ | 1,862.0 |
| | | $ | 1,342.0 |
| | | 38.7 | % | | | $ | 1,099.7 |
| | $ | 776.2 |
| | 41.7 | % |
Segment profit | | 220.7 |
| | | 166.0 |
| | | 33.0 | % | | | 163.6 |
| | 137.3 |
| | 19.1 | % |
Operating margin | | 11.9 | % | | | 12.4 | % | | | | | | 14.9 | % | | 17.7 | % | |
|
The Work segment consists of occupational apparel and uniform product categories including the Bulwark®, Red Kap®, Timberland PRO®, Wrangler® RIGGS and Horace Small® brand industrial businesses, as well as the workwear apparel brands from the Williamson-Dickie acquisition including Dickies®, Workrite®, Walls®, Terra® and Kodiak®. The Work segment also includes the results of certain transition services related to the sale of the Licensed Sports Group (the "LSG transition services") that commenced in the second quarter of 2017.
Year Ended March 2019 Compared to Twelve Months Ended March 2018 (unaudited)
Global Work revenues increased 39% in 2019 compared to 2018. Included in the 2019 results were revenues from the Williamson-Dickie acquisition of $471.9 million through the one-year anniversary of the acquisition. The year ended March 2019 was also negatively impacted by the sale of the Van Moer business in October 2018, which resulted in lower revenues of $24.6 million. Excluding the impact of the acquisition and divestiture, revenues increased 6% compared to the 2018 period. The revenue increase was due to growth in the Timberland PRO®, Wrangler® RIGGS, Bulwark® and Red Kap® brands, partially offset by a decline in the LSG transition services revenues. The revenue increase was also due to growth in the Dickies® brand in the six months ended March 2019 compared to the six months ended March 2018.
Operating margin decreased 50 basis points in 2019 compared to 2018. Excluding amounts related to the acquisition, integration and operating results of Williamson-Dickie through the one-year anniversary of the acquisition, operating margin increased 60 basis points in 2019. The increase reflected gross margin expansion
driven by a mix-shift to higher margin businesses and pricing, partially offset by certain higher product costs.
Year Ended December 2017 Compared to Year Ended December 2016
Global Work revenues increased 42% in 2017 compared to 2016. Included in the 2017 results are revenues from the Williamson-Dickie acquisition of $247.2 million and revenues from the LSG transition services of $19.9 million. Excluding revenues from Williamson-Dickie and the LSG transition services, Work revenues increased 7% in 2017 compared to 2016 primarily due to growth in our Bulwark® brand, which was fueled by increased oil and gas exploration activities, partially offset by industry consolidation.
Operating margin decreased 280 basis points in 2017 compared to 2016. Excluding the impact of amounts related to the acquisition, integration and operating results of Williamson-Dickie, and the LSG transition services, operating margin in 2017 increased 40 basis points compared to 2016. The increase reflected gross margin expansion driven by a mix-shift to higher margin businesses.
32 VF Corporation Fiscal 2019 Form 10-K
Transition Period Three Months Ended March 2018 Compared to Three Months Ended March 2017 (unaudited)
|
| | | | | | | | | | | |
| | Three Months Ended March |
(Dollars in millions) | | 2018 | | 2017 (unaudited) | | Percent
Change |
Segment revenues | | $ | 442.3 |
| | $ | 200.0 |
| | 121.2 | % |
Segment profit | | 40.0 |
| | 37.7 |
| | 6.3 | % |
Operating margin | | 9.0 | % | | 18.8 | % | | |
Global Work revenues increased 121% in the three months ended March 2018 compared to the 2017 period. Included in these results are revenues from the Williamson-Dickie acquisition of $233.1 million and revenues from the LSG transition services of $1.5 million. Excluding revenues from Williamson-Dickie and the LSG transition services, Work revenues increased 4% in the three months ended March 2018 compared to the 2017 period. The revenue increase was primarily due to growth in our Bulwark® brand, which was fueled by sales in the oil and gas industry.
Operating margin decreased 980 basis points in the three months ended March 2018 compared to the 2017 period. Excluding the impact of amounts related to the acquisition, integration and operating results of Williamson-Dickie, and the LSG transition services, operating margin decreased 200 basis points in the three months ended March 2018. The decrease was driven by higher selling, general and administrative expenses and higher product costs, partially offset by a mix-shift to higher margin businesses.
Jeans
|
| | | | | | | | | | | | | | | | | | | | | | | | | |
| | | | | | | | | | | Year Ended December |
(Dollars in millions) | | Year Ended March 2019 | | | Twelve Months Ended March 2018 (unaudited) | | | Percent Change | | | 2017 | | 2016 | | Percent Change |
Segment revenues | | $ | 2,491.8 |
| | | $ | 2,586.6 |
| | | (3.7 | )% | | | $ | 2,597.6 |
| | $ | 2,690.1 |
| | (3.4 | )% |
Segment profit | | 300.5 |
| | | 395.8 |
| | | (24.1 | )% | | | 406.5 |
| | 479.2 |
| | (15.2 | )% |
Operating margin | | 12.1 | % | | | 15.3 | % | | | | | | 15.6 | % | | 17.8 | % | |
|
The Jeans segment consists of the global jeanswear businesses, led by the Wrangler® (excluding Wrangler® RIGGS) and Lee® brands.
Year Ended March 2019 Compared to Twelve Months Ended March 2018 (unaudited)
Global Jeans revenues decreased 4% in 2019 compared to 2018, driven primarily by declines in the wholesale channel and a 2% unfavorable impact from foreign currency. Revenues in the Americas region decreased 3% in 2019, driven primarily by declines in the wholesale channel and a 1% unfavorable impact from foreign currency. The wholesale channel revenues were negatively impacted by a U.S. customer bankruptcy. Revenues in the Asia-Pacific region decreased 1% in 2019 as increases in the wholesale channel were more than offset by a 3% unfavorable impact from foreign currency. Revenues in the Europe region decreased 9% in 2019 due to declines in the wholesale and direct-to-consumer channels and a 3% unfavorable impact from foreign currency.
Global revenues for the Wrangler® brand (excluding Wrangler® RIGGS) decreased 2% in 2019, as flat wholesale channel revenues were offset by a 2% unfavorable impact from foreign currencies. Global revenues for the Lee® brand were down 7% in 2019 compared to 2018, primarily due to declines in the wholesale channel and included a 2% unfavorable impact from foreign currencies. The wholesale channel revenues of both brands were negatively impacted by a U.S. customer bankruptcy.
Operating margin decreased 320 basis points in 2019 over 2018, primarily due to higher product costs, business mix, expenses related to the separation of businesses and other strategic business decisions, and lower leverage of operating expenses due to decreased revenues, partially offset by increased pricing.
Year Ended December 2017 Compared to Year Ended December 2016
Global Jeans revenues decreased 3% in 2017 compared to 2016, including a 1% favorable impact from foreign currency, as growth in the direct-to-consumer channel was more than offset by U.S. wholesale declines in the mass, mid-tier and department store channels. Specifically, our U.S. wholesale business has been impacted by a key customer's inventory destocking decision and continued channel consolidation, which was partially mitigated by strong growth with our digital wholesale partners. Revenues in the Americas region decreased 5% in 2017, including a 1% unfavorable impact from foreign currency, driven by softness in the wholesale channel. Revenues in the Asia-Pacific region decreased 3% in 2017 due to declines in the wholesale channel in Asia and India, partially offset by growth in the direct-to-consumer channel in Asia. European revenues increased 4% in 2017 due to growth in our wholesale and direct-to-consumer businesses, and a 2% favorable impact from foreign currency.
Global revenues for the Wrangler® brand (excluding Wrangler® RIGGS) decreased 2% in 2017, including a 1% favorable impact from foreign currency, driven by declines in the U.S. mass and western specialty businesses. Global revenues for the Lee® brand were down 6% in 2017 compared to 2016, due to declines in the U.S. mid-tier and department store channels, which were partially offset by growth in the direct-to-consumer channel.
Operating margin decreased 220 basis points in 2017 over 2016, primarily due to lower revenues, gross margin contraction from higher product costs and additional investments in our strategic growth priorities.
VF Corporation Fiscal 2019 Form 10-K 33
Transition Period Three Months Ended March 2018 Compared to Three Months Ended March 2017 (unaudited)
|
| | | | | | | | | | | |
| | Three Months Ended March |
(Dollars in millions) | | 2018 | | 2017 (unaudited) | | Percent Change |
Segment revenues | | $ | 623.3 |
| | $ | 634.3 |
| | (1.7 | )% |
Segment profit | | 103.8 |
| | 114.5 |
| | (9.3 | )% |
Operating margin | | 16.7 | % | | 18.1 | % | | |
Global Jeans revenues decreased 2% in the three months ended March 2018 compared to the 2017 period. Growth in direct-to-consumer and digital wholesale, including expansion into new channels, was more than offset by continued disruption in the U.S. wholesale market. Global revenues reflect a 3% favorable impact from foreign currency. Revenues in the Americas region decreased 5% in the three months ended March 2018, driven by softness in the wholesale channel. Revenues in the Asia-Pacific region decreased 3% in the three months ended March 2018 due to declines in the wholesale channel, partially offset by an 8% favorable impact from foreign currency. European revenues increased 14% in the three months ended March 2018, primarily due to a 13% favorable impact from foreign currency and growth in our direct-to-consumer businesses.
Global revenues for the Wrangler® brand (excluding Wrangler® RIGGS) brand increased 2% in the three months ended March 2018 compared to the 2017 period, driven by flat wholesale channel revenues and a 2% favorable impact from foreign currency. Global revenues for the Lee® brand decreased 6% in the three months ended March 2018 due to declines in the U.S. mid-tier and department store channels, which were partially offset by growth in the direct-to-consumer channel. Foreign currency favorably impacted Lee® brand global revenues by 5%.
Operating margin decreased 140 basis points in the three months ended March 2018 compared to the 2017 period. The decrease was primarily due to lower revenues, higher product costs and additional investments in our strategic growth priorities, partially offset by pricing.
Other
|
| | | | | | | | | | | | | | | | | | | | | | | | | |
| | | | | | | | | | | Year Ended December |
(Dollars in millions) | | Year Ended March 2019 | | | Twelve Months Ended March 2018 (unaudited) | | | Percent Change | | | 2017 | | 2016 | | Percent Change |
Segment revenues | | $ | 124.1 |
| | | $ | 111.3 |
| | | 11.5 | % | | | $ | 113.2 |
| | $ | 118.0 |
| | (4.2 | )% |
Segment profit (loss) | | 0.5 |
| | | (4.0 | ) | | | * |
| | | (3.0 | ) | | (4.9 | ) | | 35.7 | % |
Operating margin | | 0.4 | % | | | (3.6 | )% | | | | | | (2.7 | )% | | (4.1 | )% | | |
*Calculation not meaningful
VF Outlet™ stores in the U.S. sell both VF and non-VF products. Revenues and profits of VF products sold in these stores are reported as part of the operating results of the applicable segment, while revenues and profits of non-VF products are reported in this
"other" category. Also included in this category are results from transition services related to the sales of the Nautica® and Reef® brands that commenced in the three months ended June 2018 and December 2018, respectively.
Transition Period Three Months Ended March 2018 Compared to Three Months Ended March 2017 (unaudited)
|
| | | | | | | | | | | |
| | Three Months Ended March |
(Dollars in millions) | | 2018 | | 2017 (unaudited) | | Percent Change |
Segment revenues | | $ | 20.2 |
| | $ | 22.1 |
| | (8.4 | )% |
Segment profit (loss) | | (3.1 | ) | | (2.3 | ) | | (40.0 | )% |
Operating margin | | (15.2 | )% | | (9.9 | )% | | |
VF Outlet™ stores in the U.S. sell both VF and non-VF products. Revenues and profits of VF products sold in these stores are reported as part of the operating results of the applicable segment, while revenues and profits of non-VF products are reported in this “other” category.
34 VF Corporation Fiscal 2019 Form 10-K
|
|
Reconciliation of Segment Profit to Consolidated Income Before Income Taxes |
There are three types of costs necessary to reconcile total segment profit to consolidated income before income taxes. These costs are (i) impairment of goodwill and intangible assets, which is excluded from segment profit because these costs are not part of the ongoing operations of the respective businesses, (ii) interest expense, net, which is excluded from segment profit because substantially all financing costs are managed at the corporate office and are not
under the control of segment management, and (iii) corporate and other expenses, discussed below, which are excluded from segment profit to the extent they are not allocated to the segments. Impairment of goodwill and intangible assets and net interest expense are discussed in the “Consolidated Statements of Income” section, and corporate and other expenses are discussed below.
Following is a summary of VF’s corporate and other expenses:
|
| | | | | | | | | | | | | |
| | Year Ended March 2019 | | | Year Ended December |
(In millions) | | | | 2017 | | 2016 |
Information systems and shared services | | $ | 418.1 |
| | | $ | 365.0 |
| | $ | 333.0 |
|
Less costs allocated to segments | | (255.6 | ) | | | (228.4 | ) | | (213.9 | ) |
Information systems and shared services retained at corporate | | 162.5 |
| | | 136.6 |
| | 119.1 |
|
Corporate headquarters’ costs | | 327.1 |
| | | 218.4 |
| | 169.1 |
|
Other | | 89.3 |
| | | 53.0 |
| | 96.2 |
|
Corporate and other expenses | | $ | 578.9 |
| | | $ | 408.0 |
| | $ | 384.4 |
|
Information Systems and Shared Services
These costs include management information systems and the centralized finance, supply chain, human resources, direct-to-consumer and customer management functions that support worldwide operations. Operating costs of information systems and shared services are charged to the segments based on utilization of those services. Costs to develop new computer applications are generally not allocated to the segments. Included in information systems and shared services costs in the year ended March 2019 and the year ended December 2017 are costs associated with software system implementations and upgrades and other strategic projects.
Corporate Headquarters’ Costs
Headquarters’ costs include compensation and benefits of corporate management and staff, legal and professional fees, and general and administrative expenses that have not been allocated to the segments. Included in corporate headquarters’ costs in the year ended March 2019 are certain expenses related to the acquisition, integration and separation of businesses, strategic project costs, cash and stock-based compensation expense and charitable contributions. The increase in corporate
headquarters’ costs in the year ended December 2017 compared to the year ended December 2016 was primarily driven by higher strategic project costs, an increase in cash and stock-based compensation expense and charitable contributions.
Other
This category includes (i) costs of corporate programs or corporate-managed decisions that are not allocated to the segments, (ii) costs of registering, maintaining and enforcing certain of VF’s trademarks, and (iii) miscellaneous consolidated costs, the most significant of which is related to the expense of VF’s centrally-managed U.S. defined benefit pension plans. Included in other expense in the year ended March 2019 is the loss on sale of the Reef® brand business of $14.4 million and loss on sale of $22.4 million related to the divestiture of the Van Moer business. The decrease in other expense in the year ended December 2017 compared to the year ended December 2016 was largely driven by a $50.9 million settlement charge in 2016 related to our U.S. pension obligation, resulting from offering former employees a one-time option to receive a lump sum distribution of their deferred vested benefits.
Transition Period Three Months Ended March 2018 Compared to Three Months Ended March 2017 (unaudited)
|
| | | | | | | | | | | | |
| | Three Months Ended March |
(Dollars in millions) | | 2018 | | | 2017 (unaudited) | | Percent Change |
Corporate and other expenses | | $ | 107.8 |
| | | $ | 83.1 |
| | 29.7 | % |
Interest expense, net | | 21.2 |
| | | 20.2 |
| | 4.8 | % |
Corporate and other expenses are those that have not been allocated to the segments for internal management reporting, including (i) information systems and shared service costs, (ii) corporate headquarters costs, and (iii) certain other income and expenses. The increases in corporate and other expenses in the three months ended March 2018 compared to the 2017 period resulted primarily from higher compensation costs and
investments in our key strategic growth initiatives, including expenses related to the acquisition and integration of businesses. Certain corporate overhead costs previously allocated in 2017 to the former Sportswear segment, the former Outdoor and Action Sports segment and the former Imagewear segment for segment reporting purposes have been reallocated to continuing operations as discussed in Note 4 to the consolidated financial statements.
VF Corporation Fiscal 2019 Form 10-K 35
International revenues increased 10% in the year ended March 2019 over the twelve months ended March 2018 compared to an increase of 12% in the year ended December 2017. Foreign currency negatively impacted international revenue growth by 3% in the year ended March 2019 compared to a favorable impact of 1% in the year ended December 2017. Revenues in the Europe region increased 8% in the year ended March 2019, reflecting operational growth and included a 2% unfavorable impact from foreign currency. Revenues in the Europe region increased 15% in the year ended December 2017, including a 2% benefit from foreign currency. In the Asia-Pacific region, revenues increased 15% in the year ended March 2019 over the twelve months ended March 2018,
driven by growth in China. Foreign currency negatively impacted revenues in the Asia-Pacific region by 2%. For the year ended December 2017, revenues in the Asia-Pacific region increased 6%. Revenues in the Americas (non-U.S.) region grew 14% in the year ended March 2019, reflecting operational growth, partially offset by a 7% unfavorable impact from foreign currencies. Revenues in the Americas (non-U.S.) region grew 13% in the year ended December 2017, including a 1% benefit from foreign currency. International revenue growth in the year ended March 2019 included a 6 percent contribution from acquisitions. International revenues were 41% and 42% of total VF revenues in the year ended March 2019 and the twelve months ended March 2018, respectively.
Transition Period Three Months Ended March 2018 Compared to Three Months Ended March 2017 (unaudited)
International revenues increased 27% in the three months ended March 2018 compared to the 2017 period. Foreign currency favorably impacted international revenue growth by 11% in the three months ended March 2018. Revenues in the Europe region increased 33% in the three months ended March 2018, reflecting operational growth and a 14% favorable impact from foreign currency. In the Asia-Pacific region, revenues increased 17% in the three months ended March 2018, driven by growth across the
region, particularly in China. Foreign currency favorably impacted revenues in the Asia-Pacific region by 7% in the three months ended March 2018. Revenue growth in the Americas (non-U.S.) region increased 22% in the three months ended March 2018, reflecting operational growth and a 5% favorable impact from foreign currencies in the region. International revenues were 46% and 44% of total revenues in the three months ended March 2018 and 2017, respectively.
|
|
Direct-to-Consumer Operations |
Direct-to-consumer revenues grew 14% in the year ended March 2019 over the twelve months ended March 2018 compared to growth of 17% in the year ended December 2017, reflecting growth in all regions. Foreign currency negatively impacted direct-to-consumer revenue growth by 1% in the year ended March 2019 and favorably impacted direct-to-consumer revenue growth by 1% in the year ended December 2017. The increase in direct-to-consumer revenues in both periods was due to comparable store growth for locations open at least twelve months at each reporting date, and an expanding e-commerce business which grew 32% and 34% in the year ended March 2019 and the year ended December
2017, respectively, including a 1% unfavorable impact from foreign currency in the year ended March 2019. Acquisitions contributed 3 percent to the direct-to-consumer revenue growth and 9 percent to the e-commerce revenue growth in the year ended March 2019. VF opened 110 stores in the year ended March 2019, bringing the total number of VF-owned retail stores to 1,551 at March 2019, including 34 Icebreaker and Altra stores. There were 1,518 VF-owned retail stores at December 2017. Direct-to-consumer revenues were 33% of total VF revenues in the year ended March 2019 compared to 32% in the twelve months ended March 2018.
Transition Period Three Months Ended March 2018 Compared to Three Months Ended March 2017 (unaudited)
Direct-to-consumer revenues grew 34% in the three months ended March 2018, reflecting growth in all regions and in nearly every brand with a retail format, and a 5% favorable impact from foreign currency. The increase in direct-to-consumer revenues was due to comparable store growth for locations open at least twelve months at each reporting date, and an expanding e-commerce business,
which grew 61% in the three months ended March 2018, including a 7% favorable impact from foreign currency. There were 1,483 VF-owned retail stores, including 81 Williamson-Dickie stores, at the end of March 2018 compared to 1,433 at the end of March 2017. Direct-to-consumer revenues were 32% and 29% of total revenues in the three months ended March 2018 and 2017, respectively.
36 VF Corporation Fiscal 2019 Form 10-K
Year Ended March 2019 Compared to Twelve Months Ended March 2018 (unaudited) - Condensed Consolidated Statements of Income
The unaudited Condensed Consolidated Statement of Income for the twelve months ended March 2018 is presented below for reference in the comparison to the year ended March 2019:
|
| | | | | | | | | |
(In thousands, except per share amounts) | | Year Ended March 2019 | | | Twelve Months Ended March 2018 (unaudited) |
Net revenues | | $ | 13,848,660 |
| | | $ | 12,356,283 |
|
Costs and operating expenses | | | | | |
Cost of goods sold | | 6,827,481 |
| | | 6,107,671 |
|
Selling, general and administrative expenses | | 5,345,339 |
| | | 4,718,725 |
|
Total costs and operating expenses | | 12,172,820 |
| | | 10,826,396 |
|
Operating income (a) | | 1,675,840 |
| | | 1,529,887 |
|
Interest, net | | (85,425 | ) | | | (86,857 | ) |
Other income (expense), net (a) | | (63,011 | ) | | | (1,799 | ) |
Income from continuing operations before income taxes | | 1,527,404 |
| | | 1,441,231 |
|
Income taxes | | 268,400 |
| | | 672,134 |
|
Income from continuing operations | | 1,259,004 |
| | | 769,097 |
|
Income (loss) from discontinued operations, net of tax | | 788 |
| | | (110,544 | ) |
Net income | | $ | 1,259,792 |
| | | $ | 658,553 |
|
Earnings (loss) per common share - basic | | | | | |
Continuing operations | | $ | 3.19 |
| | | $ | 1.95 |
|
Discontinued operations | | — |
| | | (0.28 | ) |
Total earnings per common share - basic | | $ | 3.19 |
| | | $ | 1.67 |
|
Earnings (loss) per common share - diluted | | | | | |
Continuing operations | | $ | 3.14 |
| | | $ | 1.92 |
|
Discontinued operations | | — |
| | | (0.28 | ) |
Total earnings per common share - diluted | | $ | 3.15 |
| | | $ | 1.65 |
|
Weighted average shares outstanding | | | | | |
Basic | | 395,189 |
| | | 395,038 |
|
Diluted | | 400,496 |
| | | 399,888 |
|
| |
(a) | In the first quarter of Fiscal 2019, VF adopted ASU 2017-07, "Compensation - Retirement Benefits (Topic 715): Improving the Presentation of Net Periodic Pension Cost and Net Periodic Postretirement Benefit Costs" and restated the prior periods to conform to current year presentation. For the twelve months ended March 2018, operating income increased and other income (expense), net decreased by $5.1 million. |
VF Corporation Fiscal 2019 Form 10-K 37
Year Ended March 2019 Compared to Twelve Months Ended March 2018 (unaudited) - Condensed Consolidated Statements of Cash Flows
The unaudited Condensed Consolidated Statement of Cash Flows for the twelve months ended March 2018 is presented below for reference in the comparison to the year ended March 2019:
|
| | | | | | | | | |
(In thousands) | | Year Ended March 2019 | | | Twelve Months Ended March 2018 (unaudited) |
OPERATING ACTIVITIES | | | | | |
Net income | | $ | 1,259,792 |
| | | $ | 658,553 |
|
Impairment of goodwill | | — |
| | | 104,651 |
|
Depreciation and amortization | | 301,005 |
| | | 295,597 |
|
Other adjustments | | 103,426 |
| | | 382,798 |
|
Cash provided by operating activities | | 1,664,223 |
| | | 1,441,599 |
|
INVESTING ACTIVITIES | | | | | |
Business acquisitions, net of cash received | | (320,405 | ) | | | (740,541 | ) |
Proceeds from sale of businesses, net of cash sold | | 430,286 |
| | | 214,968 |
|
Capital expenditures | | (250,634 | ) | | | (183,071 | ) |
Software purchases | | (56,207 | ) | | | (63,809 | ) |
Other, net | | (23,672 | ) | | | 8,549 |
|
Cash used by investing activities | | (220,632 | ) | | | (763,904 | ) |
FINANCING ACTIVITIES | | | | | |
Net increase from short-term borrowings, long-term debt and other | | (872,564 | ) | | | 965,311 |
|
Purchases of treasury stock | | (150,676 | ) | | | (1,012,341 | ) |
Cash dividends paid | | (767,061 | ) | | | (693,339 | ) |
Proceeds from issuance of Common Stock, net of shares withheld for taxes | | 199,296 |
| | | 130,627 |
|
Cash used by financing activities | | (1,591,005 | ) | | | (609,742 | ) |
Effect of foreign currency rate changes on cash, cash equivalents and restricted cash | | 14,811 |
| | | 12,957 |
|
Net change in cash, cash equivalents and restricted cash | | (132,603 | ) | | | 80,910 |
|
Cash, cash equivalents and restricted cash — beginning of period | | 689,190 |
| | | 608,280 |
|
Cash, cash equivalents and restricted cash — end of period | | $ | 556,587 |
| | | $ | 689,190 |
|
The cash flows related to discontinued operations have not been segregated, and are included in the Condensed Consolidated Statements of Cash Flows.
38 VF Corporation Fiscal 2019 Form 10-K
Transition Period Three Months Ended March 2018 Compared to Three Months Ended March 2017 (unaudited) - Condensed Consolidated Statements of Income
The unaudited Condensed Consolidated Statement of Income for the three months ended March 2017 is presented below for reference in the comparison to the three months ended March 2018:
|
| | | | | | | |
| Three Months Ended March (Transition Period) | | Three Months Ended March (unaudited) |
(In thousands, except per share amounts) | 2018 | | 2017 |
Net revenues | $ | 3,045,446 |
| | $ | 2,500,340 |
|
Costs and operating expenses | | | |
Cost of goods sold | 1,506,335 |
| | 1,243,605 |
|
Selling, general and administrative expenses | 1,229,046 |
| | 963,528 |
|
Total costs and operating expenses | 2,735,381 |
| | 2,207,133 |
|
Operating income (a) | 310,065 |
| | 293,207 |
|
Interest, net | (21,165 | ) | | (20,188 | ) |
Other income (expense), net (a) | 5,233 |
| | (3,622 | ) |
Income from continuing operations before income taxes | 294,133 |
| | 269,397 |
|
Income taxes | 32,969 |
| | 56,121 |
|
Income from continuing operations | 261,164 |
| | 213,276 |
|
Loss from discontinued operations, net of tax | (8,371 | ) | | (4,113 | ) |
Net income | $ | 252,793 |
| | $ | 209,163 |
|
Earnings (loss) per common share - basic | | | |
Continuing operations | $ | 0.66 |
| | $ | 0.52 |
|
Discontinued operations | (0.02 | ) | | (0.01 | ) |
Total earnings per common share - basic | $ | 0.64 |
| | $ | 0.51 |
|
Earnings (loss) per common share - diluted | | | |
Continuing operations | $ | 0.65 |
| | $ | 0.51 |
|
Discontinued operations | (0.02 | ) | | (0.01 | ) |
Total earnings per common share - diluted | $ | 0.63 |
| | $ | 0.50 |
|
Weighted average shares outstanding | | | |
Basic | 395,253 |
| | 411,990 |
|
Diluted | 401,276 |
| | 415,960 |
|
| |
(a) | In the first quarter of Fiscal 2019, VF adopted ASU 2017-07, "Compensation - Retirement Benefits (Topic 715): Improving the Presentation of Net Periodic Pension Cost and Net Periodic Postretirement Benefit Cost" and restated the prior periods to conform to current year presentation. Operating income decreased and other income (expense), net increased by $1.3 million and operating income increased and other income (expense), net decreased by $3.5 million for the three months ended March 2018 and March 2017, respectively. |
VF Corporation Fiscal 2019 Form 10-K 39
Transition Period Three Months Ended March 2018 Compared to Three Months Ended March 2017 (unaudited) - Condensed Consolidated Statements of Cash Flows
The unaudited Condensed Consolidated Statement of Cash Flows for the three months ended March 2017 is presented below for reference in the comparison to the three months ended March 2018:
|
| | | | | | | |
| Three Months Ended March (Transition Period) | | Three Months Ended March (unaudited) |
(In thousands) | 2018 | | 2017 |
OPERATING ACTIVITIES | | | |
Net income | $ | 252,793 |
| | $ | 209,163 |
|
Depreciation and amortization | 71,532 |
| | 66,438 |
|
Other adjustments | (567,548 | ) | | (485,763 | ) |
Cash used by operating activities | (243,223 | ) | | (210,162 | ) |
INVESTING ACTIVITIES | | | |
Capital expenditures | (54,374 | ) | | (40,856 | ) |
Software purchases | (19,289 | ) | | (20,657 | ) |
Other, net | 17,673 |
| | (6,824 | ) |
Cash used by investing activities | (55,990 | ) | | (68,337 | ) |
FINANCING ACTIVITIES | | | |
Net increase from short-term borrowings, long-term debt and other | 794,424 |
| | 261,252 |
|
Purchases of treasury stock | (250,282 | ) | | (438,297 | ) |
Cash dividends paid | (181,373 | ) | | (172,713 | ) |
Proceeds from issuance of Common Stock, net of shares withheld for taxes | 44,017 |
| | 3,283 |
|
Cash provided (used) by financing activities | 406,786 |
| | (346,475 | ) |
Effect of foreign currency rate changes on cash, cash equivalents and restricted cash | 12,220 |
| | 2,228 |
|
Net change in cash, cash equivalents and restricted cash | 119,793 |
| | (622,746 | ) |
Cash, cash equivalents and restricted cash — beginning of period | 569,397 |
| | 1,231,026 |
|
Cash, cash equivalents and restricted cash — end of period | $ | 689,190 |
| | $ | 608,280 |
|
The cash flows related to discontinued operations have not been segregated, and are included in the Condensed Consolidated Statements of Cash Flows.
40 VF Corporation Fiscal 2019 Form 10-K
|
|
ANALYSIS OF FINANCIAL CONDITION |
The following discussion refers to significant changes in balances at March 2019 compared to March 2018:
| |
• | Increase in accounts receivable — primarily due to the reclassification of certain allowances to accrued liabilities due to the adoption of Financial Accounting Standards Board Accounting Standards Codification Topic 606, Revenue from Contracts with Customers ("ASC 606"), higher wholesale shipments and the timing of cash collections. |
| |
• | Increase in other current assets — primarily due to the reclassification of the right of return asset from inventories due to the adoption of ASC 606 and an increase in derivative assets. |
| |
• | Increase in other assets — primarily due to an increase in net pension assets for certain defined benefit plans. |
| |
• | Decrease in short-term borrowings — due to net repayment of commercial paper borrowings. |
| |
• | Increase in accounts payable — driven by the timing of inventory purchases and payments to vendors. |
| |
• | Increase in accrued liabilities — primarily due to the reclassification of certain allowances from accounts receivable due to the adoption of ASC 606 and higher accrued compensation, partially offset by a decrease in derivative liabilities. |
The following discussion refers to significant changes in balances at March 2018 compared to December 2017:
| |
• | Increase in inventories — due to the seasonality of the business. |
| |
• | Increase in other current assets — primarily due to higher levels of prepaid expenses. |
| |
• | Increase in short-term borrowings — due to commercial paper borrowings needed to support general corporate purposes, share repurchases and funding for the Icebreaker® transaction which closed on April 3, 2018. |
| |
• | Decrease in accounts payable — driven by the timing of inventory purchases and payments to vendors. |
| |
• | Decrease in accrued liabilities — primarily due to lower accrued compensation, accrued income taxes and the timing of payments for other accruals. |
The financial condition of VF is reflected in the following:
|
| | | | | | | |
| | March | | | March | | December |
(Dollars in millions) | | 2019 | | | 2018 | | 2017 |
Working capital | | $2,011.9 | | | $1,256.9 | | $1,354.0 |
Current ratio | | 1.8 to 1 | | | 1.4 to 1 | | 1.5 to 1 |
Debt to total capital | | 39.3% | | | 50.4% | | 44.0% |
The increase in the current ratio at March 2019 compared to March 2018 was primarily due to a net decrease in current liabilities driven by lower short-term borrowings and a net increase in current assets driven by higher accounts receivable balances, as discussed in the "Balance Sheets" section above. The decrease in the current ratio at March 2018 compared to December 2017 was primarily driven by the increase in short-term borrowings.
For the ratio of debt to total capital, debt is defined as short-term and long-term borrowings, and total capital is defined as debt plus stockholders’ equity. The decrease in the debt to total capital ratio at March 2019 compared to March 2018 was attributed to the increase in stockholders' equity which was driven by net income and stock-based compensation activity, partially offset by payments of dividends and purchases of treasury stock. The
decrease in the debt to total capital ratio at March 2019 compared to March 2018 was also due to the decrease in short-term borrowings, as discussed in the "Balance Sheets" section above. The increase in the debt to total capital ratio at March 2018 compared to December 2017 was due to the increase in short-term borrowings, as discussed in the "Balance Sheets" section above.
VF’s primary source of liquidity is the strong annual cash flow from operating activities. Cash from operations is typically lower in the first half of the calendar year as inventory builds to support peak sales periods in the second half of the calendar year. Cash provided by operating activities in the second half of the calendar year is substantially higher as inventories are sold and accounts receivable are collected. Additionally, direct-to-consumer sales are highest in the fourth quarter of the calendar year.
VF Corporation Fiscal 2019 Form 10-K 41
In summary, our cash flows were as follows:
|
| | | | | | | | | | | | | | | | | |
| | Year Ended March 2019 | | | Twelve Months Ended March 2018 (unaudited) | | Year Ended December |
(In millions) | | | | | 2017 | | 2016 |
Cash provided by operating activities | | $ | 1,664.2 |
| | | $ | 1,441.6 |
| | $ | 1,474.7 |
| | $ | 1,480.6 |
|
Cash used by investing activities | | (220.6 | ) | | | (763.9 | ) | | (776.3 | ) | | (112.4 | ) |
Cash used by financing activities | | (1,591.0 | ) | | | (609.7 | ) | | (1,363.0 | ) | | (1,076.9 | ) |
The cash flows related to discontinued operations and held-for-sale assets and liabilities have not been segregated, and remain included in the major classes of assets and liabilities within the Consolidated Statements of Cash Flows. Accordingly, the information in the table above and cash flow discussion below include the results of continuing and discontinued operations.
Cash Provided by Operating Activities
Cash flow related to operating activities is dependent on net income, adjustments to net income and changes in working capital. The increase in cash provided by operating activities in the year ended March 2019 compared to the twelve months ended March 2018 is primarily due to higher net income in the year ended March 2019, partially offset by an increase in net cash usage for working capital.
Cash provided by operating activities remained relatively flat in the year ended December 2017 compared to the year ended December 2016 as lower net income was offset by working capital changes primarily related to an increase in accrued income tax payable resulting from the Tax Act.
Cash Used by Investing Activities
The decrease in cash used by investing activities in the year ended March 2019 related primarily to $320.4 million of net cash paid for acquisitions in the year ended March 2019 compared with $740.5 million of net cash paid for acquisitions during the twelve months ended March 2018. Investing activities also included $430.3 million of proceeds received from the sale of businesses in the year ended March 2019, which is $215.3 million higher than the proceeds received from the sales of businesses during the twelve months ended March 2018. Capital expenditures increased $67.6 million compared to the twelve months ended March 2018.
VF’s investing activities in the year ended December 2017 related primarily to the Williamson-Dickie acquisition of $740.5 million, net of cash received. Additionally, the activities included $215.0 million of proceeds from the sale of LSG, which is $99.0 million higher than the proceeds received from the sale of the former Contemporary Brands segment in the year ended December 2016. Capital expenditures of $169.6 million and software purchases of $65.2 million offset the proceeds received. Capital expenditures decreased $6.3 million compared to the year ended December 2016. Software purchases increased $21.0 million in the year ended December 2017 primarily due to system implementations and investments in our digital platform.
Cash Used by Financing Activities
The increase in cash used by financing activities in the year ended March 2019 compared to the twelve months ended March 2018 was primarily due to a $2.1 billion net decrease in cash generated by short-term borrowings driven by lower net borrowings during the year ended March 2019 compared to the twelve months ended March 2018, partially offset by a $861.7 million decrease in treasury stock purchases and a $248.6 million decrease in payments on long-term debt.
The increase in cash used by financing activities in the year ended December 2017 compared to the year ended December 2016 was driven by (i) no long-term debt borrowings in 2017 compared to $951.8 million in proceeds during 2016, (ii) the $250.0 million repayment of long-term debt, and (iii) a $199.9 million increase in purchases of treasury stock. These increases were partially offset by the $1.1 billion increase in net cash generated by short-term borrowings.
During the years ended March 2019, December 2017 and December 2016, VF purchased 1.9 million, 22.2 million and 15.9 million shares, respectively, of its Common Stock in open market transactions under the share repurchase program authorized by VF's Board of Directors. The cost was $150.7 million, $1.2 billion and $1.0 billion with an average price per share of $80.62 , $54.04 and $62.80 in the years ended March 2019, December 2017 and December 2016, respectively.
As of the end of Fiscal 2019, the Company had $3.8 billion remaining for future repurchases under its share repurchase program. VF will continue to evaluate its use of capital, giving first priority to business acquisitions and then to direct shareholder return in the form of dividends and share repurchases.
VF relies on continued strong cash generation to finance its ongoing operations. In addition, VF has significant liquidity from its available cash balances and credit facilities. In December 2018, VF entered into a $2.25 billion senior unsecured revolving line of credit (the “Global Credit Facility”) that expires in December 2023. The Global Credit Facility replaced VF's $2.25 billion revolving facility which was scheduled to expire in April 2020. VF may request an unlimited number of one year extensions so long as each extension does not cause the remaining life of the Global Credit Facility to exceed five years, subject to stated terms and conditions. The Global Credit Facility may be used to borrow funds in both U.S. dollar and certain non-U.S. dollar currencies, and has a $50.0 million letter of credit sublimit. In addition, the Global Credit Facility supports VF’s U.S. commercial paper program for short-term, seasonal working capital requirements and general corporate purposes, including share repurchases and acquisitions. Outstanding short-term balances may vary from period to period depending on the level of corporate requirements. Borrowings under the Global Credit Facility are priced at a credit spread of 81.0 basis points over the appropriate LIBOR benchmark for each currency. VF is also required to pay a facility fee to the lenders, currently equal to 6.5 basis points of the committed amount of the facility. The credit spread and facility fee are subject to adjustment based on VF’s credit ratings.
VF has a commercial paper program that allows for borrowings up to $2.25 billion to the extent that it has borrowing capacity under the Global Credit Facility. Commercial paper borrowings and standby letters of credit issued as of March 2019 were $650.0
42 VF Corporation Fiscal 2019 Form 10-K
million and $15.3 million, respectively, leaving approximately $1.6 billion available for borrowing against the Global Credit Facility at March 2019.
VF has $179.5 million of international lines of credit with various banks, which are uncommitted and may be terminated at any time by either VF or the banks. Total outstanding balances under these arrangements were $15.1 million, $25.1 million and $24.4 million at March 2019, March 2018 and December 2017, respectively. Borrowings under these arrangements had a weighted average interest rate of 24.6%, 12.0% and 9.9% at March 2019, March 2018 and December 2017, respectively, excluding accepted letters of credit which are non-interest bearing to VF. The interest-bearing borrowings include short-term borrowings in Argentina.
VF repaid $250.0 million of 5.95% fixed-rate notes on November 1, 2017, using a combination of operating cash flows and commercial paper borrowings.
VF’s favorable credit agency ratings allow for access to additional liquidity at competitive rates. At the end of March 2019, VF’s long-term debt ratings were ‘A’ by Standard & Poor’s Ratings Services and ‘A3’ by Moody’s Investors Service, and commercial paper ratings by those rating agencies were ‘A-1’ and ‘Prime-2’, respectively.
None of VF’s long-term debt agreements contain acceleration of maturity clauses based solely on changes in credit ratings. However, if there were a change in control of VF and, as a result of the change in control, the 2021, 2023 and 2037 notes were rated
below investment grade by recognized rating agencies, VF would be obligated to repurchase the notes at 101% of the aggregate principal amount, plus any accrued and unpaid interest.
Cash dividends totaled $1.94 per share in the year ended March 2019 as compared to $1.72 and $1.53 in the years ended December 2017 and 2016, respectively. The dividend payout ratio was 61.7% of diluted earnings per share in the year ended March 2019, as compared to 96.2% and 59.9% in the years ended December 2017 and 2016, respectively. The Company has declared a dividend of $0.51 per share that is payable in the first quarter of Fiscal 2020. The Company intends to reduce its quarterly dividend following the spin-off of the Jeans business in a manner that results in VF paying an annual dividend with a long-term targeted payout ratio of 50% to 55%.
On May 22, 2019, VF completed the spin-off of its Jeans business with the new company now operating as an independent, publicly traded company under the name Kontoor Brands, Inc. ("Kontoor Brands"). The spin-off is effected through a distribution to VF shareholders of one share of Kontoor Brands common stock for every seven shares of VF common stock held on the record date of May 10, 2019. In connection with the spin-off, Kontoor Brands transferred net proceeds of approximately $1.0 billion to VF and its subsidiaries from its new debt issuance, which VF intends to use to pay off its short term borrowings. In addition, VF expects an increase of approximately $150 million in capital expenditures during Fiscal 2020 driven by infrastructure investments.
Transition Period Three Months Ended March 2018 Compared to Three Months Ended March 2017 (unaudited)
In summary, our cash flows were as follows:
|
| | | | | | | |
| Three Months Ended March |
(In millions) | 2018 | | 2017 (unaudited) |
Cash used by operating activities | $ | (243.2 | ) | | $ | (210.2 | ) |
Cash used by investing activities | (56.0 | ) | | (68.3 | ) |
Cash provided (used) by financing activities | 406.8 |
| | (346.5 | ) |
The cash flows related to discontinued operations have not been segregated, and are included in the Consolidated Statements of Cash Flows. Accordingly, the information in the table above and cash flow discussion below include the results of continuing and discontinued operations.
Cash Used by Operating Activities
Cash flow related to operating activities is dependent on net income, adjustments to net income and changes in working capital. The increase in cash used by operating activities in the three months ended March 2018 is primarily due to an increase in net cash usage from working capital driven by the timing of payments and cash collections, partially offset by higher net income in the three months ended March 2018.
Cash Used by Investing Activities
The decrease in cash used by investing activities in the three months ended March 2018 was primarily due to proceeds from the sale of property, plant and equipment of $20.8 million, which was partially offset by an increase in capital expenditures of $13.5 million compared to the 2017 period.
Cash Provided (Used) by Financing Activities
The increase in cash provided by financing activities during the three months ended March 2018 was driven by a $533.8 million increase in net cash generated by short-term borrowings and a $188.0 million decline in treasury stock purchases.
During the three months ended March 2018, VF purchased 3.4 million shares of its Common Stock in open market transactions at a total cost of $250.3 million (average price per share of $74.46) under the share repurchase program authorized by VF’s Board of Directors in 2017. During the three months ended March 2017, VF purchased 8.2 million shares of its Common Stock in open market transactions at a total cost of $438.3 million (average price per share of $53.32). As of the end of March 2018, the Company had $4.0 billion remaining for future repurchases under its current share repurchase program.
VF Corporation Fiscal 2019 Form 10-K 43
Following is a summary of VF’s contractual obligations and commercial commitments at the end of March 2019 that will require the use of funds:
|
| | | | | | | | | | | | | | | | | | | | | | | | | | | |
| | | Payment Due or Forecasted by Fiscal Year |
(In millions) | Total | | 2020 | | 2021 | | 2022 | | 2023 | | 2024 | | Thereafter |
Recorded liabilities: | | | | | | | | | | | | | |
Long-term debt (1) | $ | 2,138 |
| | $ | 5 |
| | $ | 5 |
| | $ | 502 |
| | $ | 1 |
| | $ | 955 |
| | $ | 670 |
|
Other (2) | 463 |
| | 157 |
| | 71 |
| | 58 |
| | 50 |
| | 43 |
| | 84 |
|
Unrecorded commitments: | | | | | | | | | | | | | |
Interest payment obligations (3) | 757 |
| | 65 |
| | 65 |
| | 54 |
| | 47 |
| | 44 |
| | 482 |
|
Operating leases (4) | 1,434 |
| | 366 |
| | 315 |
| | 229 |
| | 164 |
| | 107 |
| | 253 |
|
Minimum royalty payments (5) | 61 |
| | 26 |
| | 13 |
| | 8 |
| | 3 |
| | 2 |
| | 9 |
|
Inventory obligations (6) | 2,583 |
| | 2,551 |
| | 18 |
| | 7 |
| | 7 |
| | — |
| | — |
|
Other obligations (7) | 174 |
| | 108 |
| | 19 |
| | 16 |
| | 12 |
| | 7 |
| | 12 |
|
| $ | 7,610 |
| | $ | 3,278 |
| | $ | 506 |
| | $ | 874 |
| | $ | 284 |
| | $ | 1,158 |
| | $ | 1,510 |
|
| |
(1) | Long-term debt consists of required principal payments on long-term debt and capital lease obligations. |
| |
(2) | Other recorded liabilities represent payments due for long-term liabilities in VF’s Consolidated Balance Sheet related to deferred compensation and other employee-related benefits, product warranty claims and other liabilities. These amounts are based on historical and forecasted cash outflows. Amounts exclude liabilities for unrecognized income tax benefits and deferred income taxes. Obligations under our qualified defined benefit pension plans and unfunded supplemental executive retirement plan are not included in the table above. Contractual cash obligations for these plans cannot be determined due to the number of assumptions required to estimate our future benefit obligations, including return on assets, discount rate and future compensation increases. The liabilities associated with these plans are presented in Note 15 to the consolidated financial statements. We currently estimate that we will make contributions of approximately $17.7 million to our pension plans during Fiscal 2020. Future contributions may differ from our planned contributions due to many factors, including changes in tax and other benefit laws, changes to the plan, or significant differences between expected and actual pension asset performance or interest rates. |
| |
(3) | Interest payment obligations represent required interest payments on long-term debt and the interest portion of payments on capital leases. Amounts exclude amortization of debt issuance costs, debt discounts and acquisition costs that would be included in interest expense in the consolidated financial statements. |
| |
(4) | Operating leases represent required minimum lease payments during the noncancelable lease term. Most real estate leases also require payment of related operating expenses such as taxes, insurance, utilities and maintenance, which are not included above. |
| |
(5) | Minimum royalty payments represent obligations under license agreements to use trademarks owned by third parties and include required minimum advertising commitments. Actual payments could exceed minimum royalty obligations. |
| |
(6) | Inventory obligations represent binding commitments to purchase finished goods, raw materials and sewing labor that are payable upon delivery of the inventory to VF. This obligation excludes the amount included in accounts payable at March 2019 related to inventory purchases. |
| |
(7) | Other obligations represent other binding commitments for the expenditure of funds, including (i) amounts related to contracts not involving the purchase of inventories, such as the noncancelable portion of service or maintenance agreements for management information systems, and (ii) capital expenditures for approved projects. |
VF had other financial commitments at the end of Fiscal 2019 that are not included in the above table but may require the use of funds under certain circumstances:
| |
• | $116.2 million of surety bonds, custom bonds, standby letters of credit and international bank guarantees are not included in the above table because they represent contingent guarantees of performance under self-insurance and other programs and would only be drawn upon if VF were to fail to meet its other obligations. |
| |
• | Purchase orders for goods or services in the ordinary course of business are not included in the above table because they represent authorizations to purchase rather than binding commitments. |
Management believes that VF’s cash balances and funds provided by operating activities, as well as its Global Credit Facility, additional borrowing capacity and access to capital markets, taken as a whole, provide (i) adequate liquidity to meet all of its current and long-term obligations when due, (ii) adequate liquidity to fund capital expenditures and to maintain the planned dividend payout rate, and (iii) flexibility to meet investment opportunities that may arise.
VF does not participate in transactions with unconsolidated entities or financial partnerships established to facilitate off-balance sheet arrangements or other limited purposes.
44 VF Corporation Fiscal 2019 Form 10-K
VF is exposed to risks in the ordinary course of business. Management regularly assesses and manages exposures to these risks through operating and financing activities and, when appropriate, by (i) taking advantage of natural hedges within VF, (ii) purchasing insurance from commercial carriers, or (iii) using derivative financial instruments. Some potential risks are discussed below:
Insured risks
VF is self-insured for a significant portion of its employee medical, workers’ compensation, vehicle and general liability exposures. VF purchases insurance from highly-rated commercial carriers to cover other risks, including directors and officers, property and umbrella, and to establish stop-loss limits on self-insurance arrangements.
Cash and equivalents risks
VF had $543.0 million of cash and equivalents at the end of Fiscal 2019. Management continually monitors the credit ratings of the financial institutions with whom VF conducts business. Similarly, management monitors the credit quality of cash equivalents.
Defined benefit pension plan risks
At the end of Fiscal 2019, VF’s defined benefit pension plans were underfunded by a net total of $67.8 million. The underfunded status includes a $118.4 million liability related to our unfunded U.S. nonqualified defined benefit plan, $62.9 million of net liabilities related to our non-U.S. defined benefit plans, and a $113.5 million asset related to our U.S. qualified defined benefit plan. VF has made significant cash contributions in recent years to improve the funded status of its plans. VF will continue to evaluate the funded status and future funding requirements of these plans, which depends in part on the future performance of the plans’ investment portfolios. Management believes that VF has sufficient liquidity to make any required contributions to the pension plans in future years.
VF’s reported earnings are subject to risks due to the volatility of its pension expense, which has ranged in recent years from $34.8 million in the year ended December 2017 to $113.0 million in the year ended December 2016, including the $50.9 million settlement charge discussed below. These fluctuations are primarily due to varying amounts of actuarial gains and losses that are deferred and amortized to future years’ expense. The assumptions that impact actuarial gains and losses include the rate of return on investments held by the pension plans, the discount rate used to value participant liabilities and demographic characteristics of the participants.
In Fiscal 2019, VF approved a freeze of all future benefit accruals under the U.S. qualified defined benefit pension plan and supplemental defined benefit pension plan, effective December 31, 2018. During the year ended December 2016, VF took an additional step in managing pension risk by offering former employees in the U.S. qualified plan a one-time option to receive a distribution of their deferred vested benefits, pursuant to which the plan paid $197.1 million in lump-sum distributions to settle $224.7 million of projected benefit obligations. The Company recorded $50.9 million in settlement charges during the year ended December 2016 to recognize the related deferred actuarial losses in accumulated other comprehensive income (loss). No additional funding of the pension plan was required as all distributions were
paid out of existing plan assets, and the plan’s funded status remained materially unchanged as a result of this offer. However, assuming other key assumptions remain unchanged, pension expense will decrease in future years due to lower amortization of net deferred actuarial losses. Refer to Note 15 to the consolidated financial statements and the “Critical Accounting Policies and Estimates” section below.
VF has taken a series of steps to manage the risk and volatility in the pension plans and their impact on the financial statements. In 2005, VF’s U.S. defined benefit plans were closed to new entrants, which did not affect the benefits of existing plan participants at that date or their accrual of future benefits. In more recent years, the investment strategy of the U.S. qualified plan has been revised to define dynamic asset allocation targets that are dependent upon changes in the plan’s funded status, capital market expectations, and risk tolerance. Additionally, VF completed the one-time lump-sum offering noted above during the year ended December 2016 which reduced the number of plan participants in the U.S. qualified plan by 23%. Also, in Fiscal 2019, VF approved a freeze of all future benefit accruals under the U.S. qualified defined benefit pension plan and supplemental defined benefit pension plan, effective December 31, 2018. Management will continue to evaluate actions that may help to reduce VF’s risks related to its defined benefit plans.
Interest rate risks
VF limits the risk of interest rate fluctuations by managing the mix of fixed and variable interest rate debt. In addition, VF may use derivative financial instruments to manage risk. Since all of VF’s long-term debt has fixed interest rates, the exposure relates to changes in interest rates on variable rate short-term borrowings (which averaged approximately $1.2 billion during Fiscal 2019). However, any change in interest rates would also affect interest income earned on VF’s cash equivalents. Based on the average amount of variable rate borrowings and cash equivalents during Fiscal 2019, the effect of a hypothetical 1% increase in interest rates would be a decrease in reported net income of approximately $8.8 million.
Foreign currency exchange rate risks
VF is a global enterprise subject to the risk of foreign currency fluctuations. Approximately 41% of VF’s revenues in the year ended March 2019 were generated in international markets. Most of VF’s foreign businesses operate in functional currencies other than the U.S. dollar. In periods where the U.S. dollar strengthens relative to the euro or other foreign currencies where VF has operations, there is a negative impact on VF’s operating results upon translation of those foreign operating results into the U.S. dollar. As discussed later in this section, management hedges VF’s investments in certain foreign operations and foreign currency transactions.
The reported values of assets and liabilities in these foreign businesses are subject to fluctuations in foreign currency exchange rates. For net advances to and investments in VF’s foreign businesses that are considered to be long-term, the impact of changes in foreign currency exchange rates on those long-term advances is deferred as a component of accumulated OCI in stockholders’ equity. The U.S. dollar value of net investments in foreign subsidiaries fluctuates with changes in the underlying functional currencies. On September 20, 2016, VF issued €850
VF Corporation Fiscal 2019 Form 10-K 45
million of euro-denominated fixed-rate notes which it has designated as a net investment hedge of VF’s investment in certain foreign operations. Because this debt qualified as a nonderivative hedging instrument, foreign currency transaction gains or losses of the debt are deferred in the foreign currency translation and other component of accumulated OCI as an offset to the foreign currency translation adjustments on the hedged investments. Any amounts deferred in accumulated OCI will remain until the hedged investment is sold or substantially liquidated.
VF monitors net foreign currency market exposures and enters into derivative foreign currency contracts to hedge the effects of exchange rate fluctuations for a significant portion of forecasted foreign currency cash flows or specific foreign currency transactions (relating to cross-border inventory purchases, production costs, product sales, operating costs and intercompany royalty payments). VF’s practice is to buy or sell foreign currency exchange contracts that cover up to 80% of foreign currency exposures for periods of up to 24 months. Currently, VF uses only foreign exchange forward contracts but may use options or collars in the future. This use of financial instruments allows management to reduce the overall exposure to risks from exchange rate fluctuations on VF’s cash flows and earnings, since gains and losses on these contracts will offset losses and gains on the transactions being hedged.
For cash flow hedging contracts outstanding at the end of Fiscal 2019, if there were a hypothetical 10% change in foreign currency exchange rates compared to rates at the end of Fiscal 2019, it would result in a change in fair value of those contracts of approximately $245 million. However, any change in the fair value of the hedging contracts would be substantially offset by a change in the fair value of the underlying hedged exposure impacted by the currency rate changes.
Counterparty risks
VF is exposed to credit-related losses in the event of nonperformance by counterparties to derivative hedging instruments. To manage this risk, we have established counterparty credit guidelines and only enter into derivative transactions with financial institutions that have ‘A minus/A3’ investment grade credit ratings or better. VF continually monitors the credit rating of, and limits the amount hedged with, each counterparty. Additionally, management utilizes a portfolio of financial institutions to minimize exposure to potential counterparty defaults and adjusts positions as necessary. VF also monitors counterparty risk for derivative contracts within the defined benefit pension plans.
Commodity price risks
VF is exposed to market risks for the pricing of cotton, leather, rubber, wool and other materials, which we either purchase directly or in a converted form such as fabric or shoe soles. To manage risks of commodity price changes, management negotiates prices in advance when possible. VF has not historically managed commodity price exposures by using derivative instruments.
Deferred compensation and related investment security risks
VF has nonqualified deferred compensation plans in which liabilities to the plans’ participants are based on the market values of the participants’ selection of a hypothetical portfolio of investment funds. VF invests in a portfolio of securities that substantially mirrors the participants’ investment selections. The increases and decreases in deferred compensation liabilities are substantially offset by corresponding increases and decreases in the market value of VF’s investments, resulting in an insignificant net exposure to operating results and financial position.
|
|
CRITICAL ACCOUNTING POLICIES AND ESTIMATES |
VF has chosen accounting policies that management believes are appropriate to accurately and fairly report VF’s operating results and financial position in conformity with accounting principles generally accepted in the U.S. VF applies these accounting policies in a consistent manner. Significant accounting policies are summarized in Note 1 to the consolidated financial statements.
The application of these accounting policies requires that VF make estimates and assumptions about future events and apply judgments that affect the reported amounts of assets, liabilities, revenues, expenses, contingent assets and liabilities, and related disclosures. These estimates, assumptions and judgments are based on historical experience, current trends and other factors believed to be reasonable under the circumstances. Management evaluates these estimates and assumptions on an ongoing basis. Because VF’s business cycle is relatively short (i.e., from the date
that inventory is received until that inventory is sold and the trade receivable is collected), actual results related to most estimates are known within a few months after any balance sheet date. In addition, VF may retain outside specialists to assist in valuations of business acquisitions, impairment testing of goodwill and intangible assets, equity compensation, pension benefits and self-insured liabilities. If actual results ultimately differ from previous estimates, the revisions are included in results of operations when the actual amounts become known.
VF believes the following accounting policies involve the most significant management estimates, assumptions and judgments used in preparation of the consolidated financial statements or are the most sensitive to change from outside factors. The application of these critical accounting policies and estimates is discussed with the Audit Committee of the Board of Directors.
VF’s inventories are stated at the lower of cost or net realizable value. Cost includes all material, labor and overhead costs incurred to manufacture or purchase the finished goods. Overhead allocated to manufactured product is based on the normal capacity of plants and does not include amounts related to idle capacity or abnormal production inefficiencies. VF performs a detailed review at each business unit, at least quarterly, of all inventories on the basis of
individual styles or individual style-size-color stock keeping units to identify slow moving or excess products, discontinued and to-be-discontinued products, and off-quality merchandise. This review matches inventory on hand, plus current production and purchase commitments, with current and expected future sales orders. Management performs an evaluation to estimate net realizable value using a systematic and consistent methodology of
46 VF Corporation Fiscal 2019 Form 10-K
forecasting future demand, market conditions and selling prices less costs of disposal. If the estimated net realizable value is less than cost, VF provides an allowance to reflect the lower value of that inventory. This methodology recognizes inventory exposures at the time such losses are evident rather than at the time goods are actually sold. Historically, these estimates of future demand and selling prices have not varied significantly from actual results due to VF’s timely identification and ability to rapidly dispose of these distressed inventories.
Existence of physical inventory is verified through periodic physical inventory counts and ongoing cycle counts at most locations throughout the year. VF provides for estimated inventory losses that have likely occurred since the last physical inventory date. Historically, physical inventory shrinkage has not been material.
|
|
Long-Lived Assets, Including Intangible Assets and Goodwill |
VF allocates the purchase price of an acquired business to the fair values of the tangible and intangible assets acquired and liabilities assumed, with any excess purchase price recorded as goodwill. VF evaluates fair value at acquisition using three valuation techniques - the replacement cost, market and income methods - and weights the valuation methods based on what is most appropriate in the circumstances. The process of assigning fair values, particularly to acquired intangible assets, is highly subjective.
Fair value for acquired intangible assets is generally based on the present value of expected cash flows. Indefinite-lived trademark or trade name intangible assets (collectively referred to herein as “trademarks”) represent individually acquired trademarks, some of which are registered in multiple countries. Definite-lived customer relationship intangible assets are based on the value of relationships with wholesale customers at the time of acquisition. Definite-lived license intangible assets relate to VF's licensing contracts with customers. Goodwill represents the excess of cost of an acquired business over the fair value of net tangible assets and identifiable intangible assets acquired, and is assigned at the reporting unit level.
VF’s depreciation policies for property, plant and equipment reflect judgments on their estimated economic lives and residual value, if any. VF’s amortization policies for definite-lived intangible assets reflect judgments on the estimated amounts and duration of future cash flows expected to be generated by those assets. In evaluating the amortizable life for customer relationship intangible assets, management considers historical attrition patterns for various groups of customers. For license-related intangible assets, management considers historical trends and anticipated license renewal periods.
Testing of Definite-Lived Assets
VF’s policy is to review property, plant and equipment and definite-lived intangible assets for potential impairment whenever events or changes in circumstances indicate that the carrying value of an asset or asset group may not be recoverable. VF tests for potential impairment at the asset or asset group level, which is the lowest level for which there are identifiable cash flows that are largely independent. VF measures recoverability of the carrying value of an asset or asset group by comparison to the estimated undiscounted cash flows expected to be generated by the asset. If the forecasted undiscounted cash flows to be generated by the asset are not expected to be adequate to recover the asset’s carrying value, a fair value analysis must be performed, and an impairment charge is recorded if there is an excess of the asset’s carrying value over its estimated fair value.
When testing property, plant and equipment for potential impairment, VF uses the income-based discounted cash flow method using the estimated cash flows of the respective asset or
asset group. The estimated undiscounted cash flows of the asset or asset group through the end of its useful life are compared to its carrying value. If the undiscounted cash flows of the asset or asset group exceed its carrying value, there is no impairment charge. If the undiscounted cash flows of the asset or asset group are less than its carrying value, the estimated fair value of the asset or asset group is calculated based on the after-tax discounted cash flows using an appropriate weighted average cost of capital ("WACC"), and an impairment charge is recognized for the difference between the estimated fair value of the asset or asset group and its carrying value.
When testing definite-lived trademarks for potential impairment, management uses the income-based relief-from-royalty method. Under this method, forecasted revenues for products sold with the trademark are assigned a royalty rate that would be charged to license the trademark (in lieu of ownership), and the estimated undiscounted cash flows of the trademark (representing forecasted royalties avoided by owning the trademark) are compared to its carrying value. If the undiscounted cash flows of the trademark exceed its carrying value, there is no impairment charge. If the undiscounted cash flows of the trademark are less than its carrying value, the estimated fair value of the trademark is calculated in a manner consistent with indefinite-lived intangible assets discussed below, and an impairment charge is recognized for the difference between the estimated fair value of the trademark and its carrying value.
When testing customer relationship intangible assets for potential impairment, management considers historical customer attrition rates and projected revenues and profitability related to customers that existed at acquisition. Management uses the multi-period excess earnings method, which is a specific application of the discounted cash flow method, to value customer relationship assets. Under this method, VF calculates the present value of the after-tax cash flows expected to be generated by the customer relationship asset after deducting contributory asset charges.
Rock & Republic® Impairment Analysis
The Rock & Republic® brand has an exclusive wholesale distribution and licensing arrangement with Kohl's Corporation that covers all branded apparel, accessories and other merchandise. As of June 30, 2018, VF performed a quantitative impairment analysis of the Rock & Republic® amortizing trademark intangible asset to determine if the carrying value was recoverable. We determined this testing was necessary based on the expectation that certain customer contract terms would be modified. Management used the income-based relief-from-royalty method and the contractual 4% royalty rate to calculate the pre-tax undiscounted future cash flows. Based on the analysis performed, management concluded that the trademark intangible asset did not require further testing
VF Corporation Fiscal 2019 Form 10-K 47
as the undiscounted cash flows exceeded the carrying value of $49.0 million.
It is possible that VF's conclusion regarding the recoverability of the intangible asset could change in future periods as there can be no assurance that the estimates and assumptions used in the analysis as of June 30, 2018 will prove to be accurate predictions of the future.
Testing of Indefinite-Lived Assets and Goodwill
VF’s policy is to evaluate indefinite-lived intangible assets and goodwill for possible impairment as of the beginning of the fourth quarter of each year, or whenever events or changes in circumstances indicate that the fair value of such assets may be below their carrying amount. As part of its annual impairment testing, VF may elect to assess qualitative factors as a basis for determining whether it is necessary to perform quantitative impairment testing. If management’s assessment of these qualitative factors indicates that it is not more likely than not that the fair value of the intangible asset or reporting unit is less than its carrying value, then no further testing is required. Otherwise, the intangible asset or reporting unit must be quantitatively tested for impairment.
An indefinite-lived intangible asset is quantitatively tested for possible impairment by comparing the estimated fair value of the asset to its carrying value. Fair value of an indefinite-lived trademark is based on an income approach using the relief-from-royalty method. Under this method, forecasted revenues for products sold with the trademark are assigned a royalty rate that would be charged to license the trademark (in lieu of ownership), and the estimated fair value is calculated as the present value of those forecasted royalties avoided by owning the trademark. The appropriate discount rate is based on the reporting unit’s WACC that considers market participant assumptions, plus a spread that factors in the risk of the intangible asset. The royalty rate is selected based on consideration of (i) royalty rates included in active license agreements, if applicable, (ii) royalty rates received by market participants in the apparel industry, and (iii) the current performance of the reporting unit. If the estimated fair value of the trademark intangible asset exceeds its carrying value, there is no impairment charge. If the estimated fair value of the trademark is less than its carrying value, an impairment charge would be recognized for the difference.
Goodwill is quantitatively evaluated for possible impairment by comparing the estimated fair value of a reporting unit to its carrying value. Reporting units are businesses with discrete financial information that is available and reviewed by segment management.
For goodwill impairment testing, VF estimates the fair value of a reporting unit using both income-based and market-based valuation methods. The income-based approach is based on the reporting unit’s forecasted future cash flows that are discounted to present value using the reporting unit’s WACC as discussed above. For the market-based approach, management uses both the guideline company and similar transaction methods. The guideline company method analyzes market multiples of revenues and earnings before interest, taxes, depreciation and amortization (“EBITDA”) for a group of comparable public companies. The market multiples used in the valuation are based on the relative strengths and weaknesses of the reporting unit compared to the selected guideline companies. Under the similar transactions method, valuation multiples are calculated utilizing actual
transaction prices and revenue/EBITDA data from target companies deemed similar to the reporting unit.
Based on the range of estimated fair values developed from the income and market-based methods, VF determines the estimated fair value for the reporting unit. If the estimated fair value of the reporting unit exceeds its carrying value, the goodwill is not impaired and no further review is required. However, if the estimated fair value of the reporting unit is less than its carrying value, VF calculates the impairment loss as the difference between the carrying value of the reporting unit and the estimated fair value.
The income-based fair value methodology requires management’s assumptions and judgments regarding economic conditions in the markets in which VF operates and conditions in the capital markets, many of which are outside of management’s control. At the reporting unit level, fair value estimation requires management’s assumptions and judgments regarding the effects of overall economic conditions on the specific reporting unit, along with assessment of the reporting unit’s strategies and forecasts of future cash flows. Forecasts of individual reporting unit cash flows involve management’s estimates and assumptions regarding:
| |
• | Annual cash flows, on a debt-free basis, arising from future revenues and profitability, changes in working capital, capital spending and income taxes for at least a 10-year forecast period. |
| |
• | A terminal growth rate for years beyond the forecast period. The terminal growth rate is selected based on consideration of growth rates used in the forecast period, historical performance of the reporting unit and economic conditions. |
| |
• | A discount rate that reflects the risks inherent in realizing the forecasted cash flows. A discount rate considers the risk-free rate of return on long-term treasury securities, the risk premium associated with investing in equity securities of comparable companies, the beta obtained from comparable companies and the cost of debt for investment grade issuers. In addition, the discount rate may consider any company-specific risk in achieving the prospective financial information. |
Under the market-based fair value methodology, judgment is required in evaluating market multiples and recent transactions. Management believes that the assumptions used for its impairment tests are representative of those that would be used by market participants performing similar valuations of VF’s reporting units.
Timberland Reporting Unit Impairment Analysis
The historical Timberland reporting unit included the Timberland PRO® brand and was included in the former Outdoor & Action Sports segment. In connection with the segment reporting changes in the first quarter of Fiscal 2019, Timberland PRO was identified as a new reporting unit. Accordingly, VF was required to evaluate whether there was any impairment at the historical Timberland reporting unit, and allocate to Timberland PRO a portion of the historical Timberland reporting unit goodwill of $844.6 million at the April 1, 2018 assessment date.
Management performed a quantitative impairment analysis and concluded that the estimated fair value of the historical Timberland reporting unit exceeded the carrying value by a substantial amount, and thus the goodwill was not impaired.
48 VF Corporation Fiscal 2019 Form 10-K
Management allocated $51.5 million of the historical Timberland reporting unit goodwill balance to Timberland PRO, based on estimated relative fair values. The goodwill for the Timberland PRO reporting unit is included in the Work reportable segment. The remaining goodwill from the historical Timberland reporting unit is included in the Outdoor reportable segment.
Management considered whether there were any triggering events that would require impairment testing for the new reporting units and determined that there were none.
Jeanswear North America Reporting Unit Impairment Analysis
The historical Jeanswear North America reporting unit included the Wrangler® RIGGS brand and was included in the former Jeanswear segment. In connection with the segment reporting changes in the first quarter of Fiscal 2019, Wrangler RIGGS was identified as a new reporting unit. Accordingly, VF was required to evaluate whether there was any impairment at the historical Jeanswear North America reporting unit, and allocate to Wrangler RIGGS a portion of the historical Jeanswear North America reporting unit goodwill of $142.1 million at the April 1, 2018 assessment date.
Management performed a quantitative impairment analysis and concluded that the estimated fair value of the historical Jeanswear North America reporting unit exceeded the carrying value by a substantial amount, and thus the goodwill was not impaired.
Management allocated $7.4 million of the historical Jeanswear North America reporting unit goodwill balance to Wrangler RIGGS, based on estimated relative fair values. The goodwill for the Wrangler RIGGS reporting unit is included in the Work reportable segment. The remaining goodwill from the historical Jeanswear North America reporting unit is included in the Jeans reportable segment.
Management considered whether there were any triggering events that would require impairment testing for the new reporting units and determined that there were none.
Reef® Impairment Analysis
In May 2018, management commenced a strategic assessment of the Reef® brand, which was considered a triggering event that required management to perform a quantitative impairment analysis of the goodwill and trademark intangible asset for the Reef® reporting unit. Based on the analyses, management concluded that the goodwill and trademark were not impaired. For goodwill, the estimated fair value of the reporting unit exceeded the carrying value by 16%. The estimated fair value of the trademark exceeded its carrying value by a significant amount.
The Reef® brand, acquired in 2005, sold surf-inspired products including sandals, shoes, swimwear, casual apparel and accessories for men, women and children. Products were sold globally through specialty stores, sporting goods chains, department stores, independent distributors and online. As part of the 2009 annual impairment analyses, VF recorded impairment charges of $31.1 million and $5.6 million related to the goodwill and trademark, respectively. The remaining carrying values of the goodwill and trademark at the May 26, 2018 testing date were $48.3 million and $74.4 million, respectively. Until its sale in October 2018, the Reef® brand was included in the Active reportable segment.
Management’s revenue and profitability forecasts used in the Reef® reporting unit and intangible asset valuations considered historical Reef® performance, strategic initiatives for the Reef® reporting unit and industry trends. Assumptions used in the valuations were similar to those that would be used by market participants performing independent valuations of the business.
Key assumptions developed by VF management and used in the quantitative analyses of the Reef® reporting unit and trademark include:
| |
• | Modest growth in the wholesale channel driven by new product offerings and door expansion with existing and new customers; |
| |
• | Modest growth in the e-commerce business; |
| |
• | Gross margin and selling, general and administrative expenses trending consistent with historical Reef® performance; |
| |
• | Royalty rates based on active license agreements of the brand; and, |
| |
• | Market-based discount rates. |
Management made its estimates based on information available as of the date of our assessment, using assumptions we believe market participants would use in performing an independent valuation of the business. VF completed the sale of the Reef® brand business on October 26, 2018.
Fiscal 2019 Annual Impairment Testing
Management performed its annual goodwill and indefinite-lived intangible asset impairment testing as of the beginning of the fourth quarter of Fiscal 2019. Management performed a qualitative analysis for all reporting units and trademark intangible assets, as discussed below in the “Qualitative impairment analysis” section.
Qualitative Impairment Analysis
For all reporting units, VF elected to perform a qualitative assessment to determine whether it is more likely than not that the goodwill and trademark intangible assets in those reporting units were impaired. In this qualitative assessment, VF considered relevant events and circumstances for each reporting unit, including (i) current year results, (ii) financial performance versus management’s annual and five-year strategic plans, (iii) changes in the reporting unit carrying value since prior year, (iv) industry and market conditions in which the reporting unit operates, (v) macroeconomic conditions, including discount rate changes, and (vi) changes in products or services offered by the reporting unit. If applicable, performance in recent years was compared to forecasts included in prior valuations. Based on the results of the qualitative assessment, VF concluded that it was not more likely than not that the carrying values of the goodwill and trademark intangible assets were greater than their fair values, and that further quantitative testing was not necessary.
Management’s Use of Estimates and Assumptions
Management made its estimates based on information available as of the date of our assessment, using assumptions we believe market participants would use in performing an independent valuation of the business. It is possible that VF’s conclusions regarding impairment or recoverability of goodwill or intangible assets in any reporting unit could change in future periods. There can be no assurance that the estimates and assumptions used in our goodwill and intangible asset impairment testing will prove to be accurate predictions of the future, if, for example, (i) the
VF Corporation Fiscal 2019 Form 10-K 49
businesses do not perform as projected, (ii) overall economic conditions in Fiscal 2020 or future years vary from current assumptions (including changes in discount rates), (iii) business conditions or strategies for a specific reporting unit change from current assumptions, including loss of major customers, (iv) investors require higher rates of return on equity investments in the marketplace, or (v) enterprise values of comparable publicly
traded companies, or actual sales transactions of comparable companies, were to decline, resulting in lower multiples of revenues and EBITDA.
A future impairment charge for goodwill or intangible assets could have a material effect on VF’s consolidated financial position and results of operations.
VF uses a lattice option-pricing model to estimate the fair value of stock options granted to employees and nonemployee members of the Board of Directors. VF believes that a lattice model provides a refined estimate of the fair value of options because it can incorporate (i) historical option exercise patterns and multiple assumptions about future option exercise patterns for each of several groups of option holders, and (ii) inputs that vary over time, such as assumptions for interest rates and volatility. Management performs an annual review of all assumptions employed in the valuation of option grants and believes they are reflective of the outstanding options and underlying Common Stock and of groups of option participants. The lattice valuation incorporates the assumptions listed in Note 17 to the consolidated financial statements.
One of the critical assumptions in the valuation process is estimating the expected average life of the options before they are exercised. For each option grant, VF estimated the expected average life based on evaluations of the historical and expected
option exercise patterns for each of the groups of option holders that have historically exhibited different option exercise patterns. These evaluations included (i) voluntary stock option exercise patterns based on a combination of changes in the price of VF Common Stock and periods of time that options are outstanding before exercise, and (ii) involuntary exercise patterns resulting from turnover, retirement and death.
Volatility is another critical assumption requiring judgment. Management bases its estimates of future volatility on a combination of implied and historical volatility. Implied volatility is based on short-term (6 to 9 months) publicly traded near-the-money options on VF Common Stock. VF measures historical volatility over a ten-year period, corresponding to the contractual term of the options, using daily stock prices. Management’s assumption for valuation purposes is that expected volatility starts at a level equal to the implied volatility and then transitions to the historical volatility over the remainder of the ten-year option term.
VF sponsors a qualified defined benefit pension plan covering most full-time U.S. employees hired before 2005 and an unfunded supplemental defined benefit pension plan ("U.S. pension plans") that provides benefits in excess of the limitations imposed by income tax regulations. In Fiscal 2019, VF approved a freeze of all future benefit accruals under the U.S. qualified defined benefit pension plan and supplemental defined benefit pension plan, effective December 31, 2018. VF also sponsors certain non-U.S. defined benefit pension plans. The selection of actuarial assumptions for determining the projected pension benefit liabilities and annual pension expense is significant due to amounts involved and the long time period over which benefits are accrued and paid.
Annually, management reviews the principal economic actuarial assumptions summarized in Note 15 to the consolidated financial statements, and revises them as appropriate based on current rates and trends as of the valuation date. VF also periodically reviews and revises, as necessary, other plan assumptions such as rates of compensation increases, retirement, termination, disability and mortality. VF believes the assumptions appropriately reflect the participants’ demographics and projected benefit obligations of the plans and result in the best estimate of the plans’ future experience. Actual results may vary from the actuarial assumptions used.
The below discussion of discount rate, return on assets and mortality assumptions relates specifically to the U.S. pension plans, as they comprise approximately 91% of VF’s total defined benefit plan assets and approximately 88% of VF’s total projected benefit obligations of the combined U.S. and international plans.
One of the critical assumptions used in the actuarial model is the discount rate, which is used to estimate the present value of future cash outflows necessary to meet projected benefit obligations for the specific plan. It is the estimated interest rate that VF could use to settle its projected benefit obligations at the valuation date. The discount rate assumption is based on current market interest rates. VF selects a discount rate for each of the U.S. pension plans by matching high quality corporate bond yields to the timing of projected benefit payments to participants in each plan. VF uses the population of U.S. corporate bonds rated ‘Aa’ by Moody’s Investors Service or Standard & Poor’s Ratings Services. VF excludes the highest and lowest yielding bonds from this population of approximately 1,046 such bonds. The bonds must be noncallable/nonputable unless make-whole provisions exist. Each plan’s projected benefit payments are matched to current market interest rates over the expected payment period to calculate an associated present value. A single equivalent discount rate is then determined that produces the same present value. The resulting discount rate is reflective of both the current interest rate environment and the plan’s distinct liability characteristics. VF believes that those ‘Aa’ rated issues meet the “high quality” intent of the applicable accounting standards and that the Fiscal 2019 discount rates of 3.98% for the U.S. qualified defined benefit pension plan and 3.99% for the unfunded supplemental defined benefit plan appropriately reflect current market conditions and the long-term nature of projected benefit payments to participants in the U.S. pension plans. These higher discount rates, compared with the rates of 3.66% for the U.S. qualified defined benefit pension plan and 3.70% for the unfunded supplemental defined benefit plan at the end of December 2017, reflect the general increase in yields
50 VF Corporation Fiscal 2019 Form 10-K
of U.S. government obligations and high quality corporate bonds during Fiscal 2019.
VF utilizes the spot rate approach to measure service and interest costs. Under the spot rate approach, the full yield curve is applied separately to cash flows for each projected benefit obligation, service cost, and interest cost for a more precise calculation.
Another critical assumption of the actuarial model is the expected long-term rate of return on investments. VF’s investment objective is to invest in a diversified portfolio of assets with an acceptable level of risk to maximize the long-term return while minimizing volatility in the value of plan assets relative to the value of plan liabilities. These risks include market, interest rate, credit, liquidity, regulatory and foreign securities risks. Investment assets consist of cash equivalents, U.S. and international equity, corporate and governmental fixed-income securities, insurance contracts, and alternative assets. VF develops a projected rate of return for each of the investment asset classes based on many factors, including historical and expected returns, the estimated inflation rate, the premium to be earned in excess of a risk-free return, the premium for equity risk and the premium for longer duration fixed-income securities. The weighted average projected long-term rates of return of the various assets held by the U.S. qualified plan provide the basis for the expected long-term rate of return actuarial assumption. VF’s rate of return assumption was 5.70% in the year ended March 2019, 5.85% in the three months ended March 2018 and 6.00% in the years ended December 2017 and 2016. In recent years, VF has altered the investment mix by (i) increasing the allocation to fixed-income investments and reducing the allocation to equity investments, and (ii) increasing the allocation in equities to more international investments. The changes in asset allocation are anticipated, over time, to reduce the year-to-year variability of the U.S. qualified plan’s funded status and resulting pension expense. Management monitors the plan’s asset allocation to balance risk with anticipated investment returns in a given year. Based on an evaluation of market conditions and projected market returns, VF will be using a rate of return assumption of 5.70% for the U.S. qualified defined benefit pension plan for Fiscal 2020.
We consistently review all of our demographic assumptions as part of the normal management of our defined benefit plans, and update these assumptions as appropriate. The Company performed a demographic assumptions study in 2017 and updated the assumptions, as necessary, in the year ended March 2019 valuations.
In 2014, the Society of Actuaries (SOA) issued new mortality tables (RP-2014) and mortality improvement scales (MP-2014) which reflect longer life expectancies than the previous tables. In 2017, the SOA issued updated scales (MP-2017), which were adjusted for characteristics of our plan-specific populations and other data where appropriate, in developing our best estimate of the expected mortality rates of plan participants in the U.S. pension plans. Management assessed the mortality assumption and concluded no change was needed for the year ended March 2019.
Differences between actual results in a given year and the actuarially determined assumed results for that year (e.g., investment performance, discount rates and other assumptions) do not affect that year’s pension expense, but instead are deferred as unrecognized actuarial gains or losses in accumulated other comprehensive income (loss) in the Consolidated Balance Sheet. At the end of Fiscal 2019 for all pension plans, there were $399.1 million of pretax accumulated deferred actuarial losses, plus $0.6 million of pretax deferred prior service costs, resulting in an after-tax amount of $243.2 million in accumulated other comprehensive income (loss) in the March 2019 Consolidated Balance Sheet. These deferred losses will be amortized as a component of pension expense.
Pension expense recognized in the consolidated financial statements was $39.7 million in the year ended March 2019, $4.6 million in the three months ended March 2018 and $34.8 million and $113.0 million in the years ended December 2017 and 2016, respectively. Pension expense for the year ended December 2016 was higher as it included a $50.9 million settlement charge resulting from 9,400 participants accepting a one-time option to receive a distribution of their deferred vested benefits (refer to Note 15). The cost of pension benefits actually earned each year by covered active employees (commonly called “service cost”) was $22.4 million in the year ended March 2019, $5.9 million in the three months ended March 2018, $24.9 million in the year ended December 2017 and $25.8 million in the year ended December 2016. Pension expense was higher in the year ended March 2019 compared to the year ended December 2017 due to settlement and curtailment charges in the year ended March 2019 (discussed in Note 15) and higher interest costs resulting from higher interest rates for the U.S. pension plans, partially offset by lower amortization of unrecognized actuarial losses. Looking forward, VF expects pension income for the next 12 months of approximately $3.3 million as a result of lower amortization of unrecognized actuarial losses and lower services costs.
The sensitivity of changes in actuarial assumptions on Fiscal 2019 pension expense and on projected benefit obligations related to the U.S. defined benefit pension plan at the end of Fiscal 2019, all other factors being equal, is illustrated by the following:
|
| | | | | | | |
| Increase (Decrease) in |
(Dollars in millions) | Pension Expense | | Projected Benefit Obligations |
0.50% decrease in discount rate | $ | 15 |
| | $ | 91 |
|
0.50% increase in discount rate | (9 | ) | | (83 | ) |
0.50% decrease in expected investment return | 8 |
| | — |
|
0.50% increase in expected investment return | (8 | ) | | — |
|
0.50% decrease in rate of compensation change | (1 | ) | | — |
|
0.50% increase in rate of compensation change | 1 |
| | — |
|
As discussed in the “Risk Management” section above, VF has taken a series of steps to reduce volatility in the pension plans and their impact on the financial statements. On a longer-term basis, VF believes the year-to-year variability of the retirement benefit expense should decrease.
VF Corporation Fiscal 2019 Form 10-K 51
As a global company, VF is subject to income taxes and files income tax returns in over 100 U.S. and foreign jurisdictions each year. As discussed in Note 18 to the consolidated financial statements, VF has been granted a lower effective income tax rate on taxable earnings in certain foreign jurisdictions. Due to economic and political conditions, tax rates in various jurisdictions may be subject to significant change. The Company could be subject to changes in its tax rates, the adoption of new U.S. or international tax legislation or exposure to additional tax liabilities. VF makes an ongoing assessment to identify any significant exposure related to increases in tax rates in the jurisdictions in which VF operates.
In February 2015, the European Union Commission (“EU”) opened a state aid investigation into Belgium’s rulings. On January 11, 2016, the EU announced its decision that these rulings were illegal and ordered that tax benefits granted under these rulings should be collected from the affected companies, including VF. On March 22, 2016, the Belgium government filed an appeal seeking annulment of the EU decision. Additionally, on June 21, 2016, VF Europe BVBA filed its own application for annulment of the EU decision. On December 22, 2016, Belgium adopted a law which entitled the Belgium tax authorities to issue tax assessments and demand timely payments from companies which benefited from the excess profits regime. On January 10, 2017, VF Europe BVBA received an assessment for €31.9 million tax and interest related to excess profits benefits received in prior years. VF Europe BVBA remitted €31.9 million ($33.9 million) on January 13, 2017, which was recorded as an income tax receivable in 2017 based on the expected success of the aforementioned requests for annulment. An additional assessment of €3.1 million ($3.8 million) was received and paid in January 2018. On February 14, 2019 the General Court annulled the EU decision and on April 26, 2019 the EU appealed the General Court’s annulment. Both listed requests for annulment remain open and unresolved. If this matter is adversely resolved, these amounts will not be collected by VF.
The calculation of income tax liabilities involves uncertainties in the application of complex tax laws and regulations, which are subject to legal interpretation and significant management judgment. VF’s income tax returns are regularly examined by federal, state and foreign tax authorities, and those audits may result in proposed adjustments. VF has reviewed all issues raised upon examination, as well as any exposure for issues that may be raised in future examinations. VF has evaluated these potential issues under the “more-likely-than-not” standard of the accounting literature. A tax position is recognized if it meets this standard and is measured at the largest amount of benefit that has a greater than 50% likelihood of being realized. Such judgments and estimates may change based on audit settlements, court cases and interpretation of tax laws and regulations. Income tax expense could be materially affected to the extent VF prevails in a tax position or when the statute of limitations expires for a tax position for which a liability for unrecognized tax benefits or valuation allowances have been established, or to the extent VF is required to pay amounts greater than the established liability for unrecognized tax benefits. VF does not currently anticipate any material impact on earnings from the ultimate resolution of income tax uncertainties. There are no accruals for general or unknown tax expenses.
VF has $249.4 million of gross deferred income tax assets related to operating loss and capital loss carryforwards, and $178.3 million of valuation allowances against those assets. Realization of
deferred tax assets related to operating loss and capital loss carryforwards is dependent on future taxable income in specific jurisdictions, the amount and timing of which are uncertain, and on possible changes in tax laws. If management believes that VF will not be able to generate sufficient taxable income or capital gains to offset losses during the carryforward periods, VF records valuation allowances to reduce those deferred tax assets to amounts expected to be ultimately realized. If in a future period management determines that the amount of deferred tax assets to be realized differs from the net recorded amount, VF would record an adjustment to income tax expense in that future period.
On December 22, 2017, the U.S. government enacted the Tax Act. The Tax Act included a broad range of complex provisions impacting the taxation of multi-national companies. Generally, accounting for the impacts of newly enacted tax legislation is required to be completed in the period of enactment; however, in response to the complexities and ambiguity surrounding the Tax Act, the SEC released Staff Accounting Bulletin No. 118 (“SAB 118”) to provide companies with relief around the initial accounting for the Tax Act. Pursuant to SAB 118, the SEC provided a one-year measurement period for companies to analyze and finalize accounting for the Tax Act. During the one-year measurement period, SAB 118 allowed companies to recognize provisional amounts when reasonable estimates could be made for the impacts resulting from the Tax Act.
VF finalized its accounting for the Tax Act during the one-year measurement period under SAB 118, and recognized additional net charges of $18.2 million, primarily comprised of $14.3 million tax expense related to the transition tax, additional tax benefits of $0.3 million related to revaluing U.S. deferred tax assets and liabilities using the new U.S. corporate tax rate of 21%, and $4.2 million tax expense related to establishing a deferred tax liability for foreign withholding taxes, resulting in a cumulative net charge of $483.7 million. The measurement period adjustments include $5.1 million of net tax benefit recognized in the three months ended March 2018 and $23.3 million of net tax expense recognized during Fiscal 2019.
On January 15, 2019 final regulations under Section 965 related to the transition tax were released. After analyzing these regulations, the Company recorded an additional net charge of $13.9 million, primarily comprised of $20.7 million tax expense related to transition tax and a net tax benefit of $6.8 million related to a reduction in unrecognized tax benefits as a result of the final regulations.
The income tax payable attributable to the transition tax is due over an 8-year period beginning in 2018. At March 30, 2019, a noncurrent income tax payable of approximately $416.1 million attributable to the transition tax is reflected in "other liabilities" of the Consolidated Balance Sheet.
The Tax Act created a new tax on certain global intangible low-tax income (“GILTI”) from foreign operations. Under GAAP, companies may make an accounting policy election to either treat taxes resulting from GILTI as a current-period expense when they are incurred or factor such amounts into the measurement of deferred taxes. The Company completed its analysis of the effects of the GILTI provisions and determined it will treat the taxes resulting from GILTI as a current-period expense, which is consistent with the treatment prior to the accounting policy election.
52 VF Corporation Fiscal 2019 Form 10-K
|
|
Recently Issued and Adopted Accounting Standards |
Refer to Note 1 to the consolidated financial statements for discussion of recently issued and adopted accounting standards.
|
|
Cautionary Statement on Forward-looking Statements |
From time to time, VF may make oral or written statements, including statements in this Annual Report that constitute “forward-looking statements” within the meaning of the federal securities laws. These include statements concerning plans, objectives, projections and expectations relating to VF’s operations or economic performance, and assumptions related thereto.
Forward-looking statements are made based on VF’s expectations and beliefs concerning future events impacting VF and therefore involve a number of risks and uncertainties. VF cautions that
forward-looking statements are not guarantees and actual results could differ materially from those expressed or implied in the forward-looking statements.
Known or unknown risks, uncertainties and other factors that could cause the actual results of operations or financial condition of VF to differ materially from those expressed or implied by such forward-looking statements are summarized in Item 1A. of this Annual Report.
|
|
ITEM 7A. QUANTITATIVE AND QUALITATIVE DISCLOSURES ABOUT MARKET RISK. |
A discussion of VF’s market risks is incorporated by reference to “Risk Management” in Item 7. “Management’s Discussion and Analysis of Financial Condition and Results of Operations” in this Annual Report.
|
|
ITEM 8. FINANCIAL STATEMENTS AND SUPPLEMENTARY DATA. |
See “Index to Consolidated Financial Statements and Financial Statement Schedule” on page F-1 of this Annual Report for information required by this Item 8.
|
|
ITEM 9. CHANGES IN AND DISAGREEMENTS WITH ACCOUNTANTS ON ACCOUNTING AND FINANCIAL DISCLOSURE. |
Not applicable.
|
|
ITEM 9A. CONTROLS AND PROCEDURES. |
|
|
CONCLUSION REGARDING THE EFFECTIVENESS OF DISCLOSURE CONTROLS AND PROCEDURES |
Under the supervision of the Chief Executive Officer and the Chief Financial Officer, VF conducted an evaluation of the effectiveness of the design and operation of VF’s “disclosure controls and procedures” as defined in Rules 13a-15(e) or 15d-15(e) of the Securities Exchange Act of 1934 (the “Exchange Act”) as of March 30, 2019. These require that VF ensure that information required to be disclosed by VF in reports that it files or submits under the Exchange Act is recorded, processed, summarized and reported within the time periods specified in the Securities and
Exchange Commission’s rules and forms and that information required to be disclosed in the reports filed or submitted under the Exchange Act is accumulated and communicated to VF’s management, including the principal executive officer and principal financial officer, to allow timely decisions regarding required disclosures. Based on VF’s evaluation, the principal executive officer and the principal financial officer concluded that VF’s disclosure controls and procedures were effective as of March 30, 2019.
|
|
MANAGEMENT’S REPORT ON INTERNAL CONTROL OVER FINANCIAL REPORTING |
VF’s management is responsible for establishing and maintaining adequate internal control over financial reporting, as defined in Exchange Act Rules 13a-15(f) or 15d-15(f). VF’s management conducted an assessment of VF’s internal control over financial reporting based on the framework described in Internal Control — Integrated Framework (2013), issued by the Committee of Sponsoring Organizations of the Treadway Commission. Based on this assessment, VF’s management has determined that VF’s
internal control over financial reporting was effective as of March 30, 2019. The effectiveness of VF’s internal control over financial reporting as of March 30, 2019 has been audited by PricewaterhouseCoopers LLP, an independent registered public accounting firm, as stated in their report which appears herein.
See page F-2 of this Annual Report for “Management’s Report on Internal Control Over Financial Reporting.”
VF Corporation Fiscal 2019 Form 10-K 53
|
|
CHANGES IN INTERNAL CONTROL OVER FINANCIAL REPORTING |
There were no changes in VF’s internal control over financial reporting that occurred during its last fiscal quarter that have materially affected, or are reasonably likely to materially affect, VF’s internal control over financial reporting.
|
|
ITEM 9B. OTHER INFORMATION. |
Not applicable.
54 VF Corporation Fiscal 2019 Form 10-K
PART III
|
|
ITEM 10. DIRECTORS, EXECUTIVE OFFICERS AND CORPORATE GOVERNANCE. |
Information regarding VF’s Executive Officers required by Item 10 of this Part III is set forth in Item 1 of Part I of this Annual Report under the caption “Executive Officers of VF.” Information required by Item 10 of Part III regarding VF’s Directors is included under the caption “Election of Directors” in VF’s 2019 Proxy Statement that will be filed with the Securities and Exchange Commission within 120 days after the close of our fiscal year ended March 30, 2019, which information is incorporated herein by reference.
Information regarding compliance with Section 16(a) of the Exchange Act of 1934 is included under the caption “Section 16(a) Beneficial Ownership Reporting Compliance” in VF’s 2019 Proxy Statement that will be filed with the Securities and Exchange Commission within 120 days after the close of our fiscal year ended March 30, 2019, which information is incorporated herein by reference.
Information regarding the Audit Committee is included under the caption “Corporate Governance at VF — Board Committees and Their Responsibilities — Audit Committee” in VF’s 2019 Proxy Statement that will be filed with the Securities and Exchange Commission within 120 days after the close of our fiscal year ended March 30, 2019, which information is incorporated herein by reference.
VF has adopted a written code of ethics, “VF Corporation Code of Business Conduct,” that is applicable to all VF directors, officers and employees, including VF’s chief executive officer, chief financial officer, chief accounting officer and other executive officers identified pursuant to this Item 10 (collectively, the “Selected Officers”). In accordance with the Securities and Exchange Commission’s rules and regulations, a copy of the code has been filed and is incorporated by reference as Exhibit 14 to this report. The code is also posted on VF’s website, www.vfc.com. VF will disclose any changes in or waivers from its code of ethics applicable to any Selected Officer or director on its website at www.vfc.com.
The Board of Directors’ Corporate Governance Principles, the Audit Committee, Nominating and Governance Committee, Compensation Committee and Finance Committee charters and other corporate governance information, including the method for interested parties to communicate directly with nonmanagement members of the Board of Directors, are available on VF’s website. These documents, as well as the VF Corporation Code of Business Conduct, will be provided free of charge to any shareholder upon request directed to the Secretary of VF Corporation at P.O. Box 21488, Greensboro, NC 27420.
|
|
ITEM 11. EXECUTIVE COMPENSATION. |
Information required by Item 11 of this Part III is included under the captions “Corporate Governance at VF — Directors’ Compensation” and “Executive Compensation” in VF’s 2019 Proxy Statement that will be filed with the Securities and Exchange Commission within 120 days after the close of our fiscal year ended March 30, 2019, which information is incorporated herein by reference.
|
|
ITEM 12. SECURITY OWNERSHIP OF CERTAIN BENEFICIAL OWNERS AND MANAGEMENT AND RELATED STOCKHOLDER MATTERS. |
Information required by Item 12 of this Part III is included under the caption “Security Ownership of Certain Beneficial Owners and Management” in VF’s 2019 Proxy Statement that will be filed with the Securities and Exchange Commission within 120 days after the close of our fiscal year ended March 30, 2019, which information is incorporated herein by reference.
|
|
ITEM 13. CERTAIN RELATIONSHIPS AND RELATED TRANSACTIONS, AND DIRECTOR INDEPENDENCE. |
Information required by Item 13 of this Part III is included under the caption “Election of Directors” in VF’s 2019 Proxy Statement that will be filed with the Securities and Exchange Commission within 120 days after the close of our fiscal year ended March 30, 2019, which information is incorporated herein by reference.
|
|
ITEM 14. PRINCIPAL ACCOUNTING FEES AND SERVICES. |
Information required by Item 14 of this Part III is included under the caption “Professional Fees of PricewaterhouseCoopers LLP” in VF’s 2019 Proxy Statement that will be filed with the Securities and Exchange Commission within 120 days after the close of our fiscal year ended March 30, 2019, which information is incorporated herein by reference.
VF Corporation Fiscal 2019 Form 10-K 55
PART IV
|
| |
ITEM 15. | EXHIBITS AND FINANCIAL STATEMENT SCHEDULES. |
(a) The following documents are filed as a part of this Fiscal 2019 report:
1. Financial statements
2. Financial statement schedules
All other schedules for which provision is made in the applicable accounting regulations of the Securities and Exchange Commission are not required under the related instructions or are inapplicable and therefore have been omitted.
3. Exhibits
|
| | | | |
NUMBER | DESCRIPTION |
| |
3. | Articles of incorporation and bylaws: |
| | | | Articles of Incorporation, restated as of October 21, 2013 (Incorporated by reference to Exhibit 3(i) to Form 8-K filed October 21, 2013) |
| | | | Amended and Restated By-Laws (Incorporated by reference to Exhibit 3(B) to Form 10-K for the year ended December 29, 2012) |
4. | Instruments defining the rights of security holders, including indentures: |
| | | | A specimen of VF’s Common Stock certificate (Incorporated by reference to Exhibit 3(C) to Form 10-K for the year ended January 3, 1998) |
| | | | Indenture between VF and United States Trust Company of New York, as Trustee, dated September 29, 2000 (Incorporated by reference to Exhibit 4.1 to Form 10-Q for the quarter ended September 30, 2000) |
| | | | Form of 6.00% Note due October 15, 2033 for $297,500,000 (Incorporated by reference to Exhibit 4.2 to Form S-4 Registration Statement No. 110458 filed November 13, 2003) |
| | | | Form of 6.00% Note due October 15, 2033 for $2,500,000 (Incorporated by reference to Exhibit 4.2 to Form S-4 Registration Statement No. 110458 filed November 13, 2003) |
| | | | Indenture between VF and The Bank of New York Trust Company, N.A., as Trustee, dated October 10, 2007 (Incorporated by reference to Exhibit 4.1 to Form S-3ASR Registration Statement No. 333-146594 filed October 10, 2007) |
| | | | First Supplemental Indenture between VF and The Bank of New York Trust Company, N.A., as Trustee, dated October 15, 2007 (Incorporated by reference to Exhibit 4.2 to Form 8-K filed October 25, 2007) |
| | | | Form of 6.45% Note due 2037 for $350,000,000 (Incorporated by reference to Exhibit 4.4 to Form 8-K filed October 25, 2007) |
| | | | Second Supplemental Indenture between VF and The Bank of New York Mellon Trust Company, N.A. dated as of August 24, 2011 (Incorporated by reference to Exhibit 4.2 to Form 8-K filed August 24, 2011) |
| | | | Form of Fixed Rate Notes due 2021 (Incorporated by reference to Exhibit 4.4 to Form 8-K filed August 24, 2011) |
| | | | Third Supplemental Indenture between VF and The Bank of New York Mellon Trust Company, N.A. dated as of September 20, 2016 (Incorporated by reference to Exhibit 4.2 to Form 8-K filed September 20, 2016) |
| | | | Form of 0.625% Senior Notes due 2023 (Incorporated by reference to Exhibit 4.3 to Form 8-K filed September 20, 2016) |
| | | | Description of Securities |
56 VF Corporation Fiscal 2019 Form 10-K
|
| | | | |
NUMBER | DESCRIPTION |
10. | Material contracts: |
| | | | 1996 Stock Compensation Plan, as amended and restated as of February 10, 2015 (Incorporated by reference to Appendix B to the 2015 Proxy Statement filed March 19, 2015)* |
| | | | Form of VF Corporation 1996 Stock Compensation Plan Non-Qualified Stock Option Certificate (Incorporated by reference to Exhibit 10(B) to Form 10-K for the year ended January 2, 2010)* |
| | | | Form of VF Corporation 1996 Stock Compensation Plan Non-Qualified Stock Option Certificate for Non-Employee Directors (Incorporated by reference to Exhibit 10(C) to Form 10-K for the year ended December 31, 2011)* |
| | | | Form of Award Certificate for Performance-Based Restricted Stock Units (Incorporated by reference to Exhibit 10(D) to Form 10-K for the year ended January 2, 2010)* |
| | | | Form of Award Certificate for Performance-Based Restricted Stock Units (Incorporated by reference to Exhibit 10(E) to Form 10-K for the year ended December 29, 2012)* |
| | | | Form of Award Certificate for Restricted Stock Units for Non-Employee Directors (Incorporated by reference to Exhibit 10(E) to Form 10-K for the year ended January 2, 2010)* |
| | | | Form of Award Certificate for Restricted Stock Units (Incorporated by reference to Exhibit 10.1 to Form 8-K filed February 22, 2011)* |
| | | | Form of Award Certificate for Restricted Stock Units for Executive Officers (Incorporated by reference to Exhibit 10(H) to Form 10-K for the year ended December 29, 2012)* |
| | | | Form of Award Certificate for Restricted Stock Award (Incorporated by reference to Exhibit 10.2 to Form 8-K filed February 22, 2011)* |
| | | | Form of Award Certificate for Restricted Stock Award for Executive Officers (Incorporated by reference to Exhibit 10(J) to Form 10-K for the year ended December 29, 2012)* |
| | | | Deferred Compensation Plan, as amended and restated as of December 31, 2001 (Incorporated by reference to Exhibit 10(A) to Form 10-Q for the quarter ended March 30, 2002)* |
| | | | Executive Deferred Savings Plan, as amended and restated as of December 31, 2001 (Incorporated by reference to Exhibit 10(B) to Form 10-Q for the quarter ended March 30, 2002)* |
| | | | Executive Deferred Savings Plan II, as amended and restated January 1, 2015 (Incorporated by reference to Item 10(M) to Form 10-K for the year ended January 3, 2015)* |
| | | | Amendment to Executive Deferred Savings Plan (Incorporated by reference to Exhibit 10(b) to Form 8-K filed December 17, 2004)* |
| | | | Amended and Restated Second Supplemental Annual Benefit Determination under the Amended and Restated Supplemental Executive Retirement Plan for Mid-Career Senior Management (Incorporated by reference to Exhibit 10.2 to Form 10-Q for the quarter ended April 1, 2006)* |
| | | | Amended and Restated Fourth Supplemental Annual Benefit Determination under the Amended and Restated Supplemental Executive Retirement Plan for Participants in VF’s Deferred Compensation Plan (Incorporated by reference to Exhibit 10.3 to Form 10-Q for the quarter ended April 1, 2006)* |
| | | | Amended and Restated Seventh Supplemental Annual Benefit Determination under the Amended and Restated Supplemental Executive Retirement Plan for Participants in VF’s Executive Deferred Savings Plan (Incorporated by reference to Exhibit 10.5 to Form 10-Q for the quarter ended April 1, 2006)* |
| | | | Amended and Restated Eighth Supplemental Annual Benefit Determination under the Amended and Restated Supplemental Executive Retirement Plan (Incorporated by reference to Exhibit 10.6 to Form 10-Q for the quarter ended April 1, 2006)* |
| | | | Amended and Restated Ninth Supplemental Annual Benefit Determination under the Amended and Restated Supplemental Executive Retirement Plan relating to the computation of benefits for Senior Management (Incorporated by reference to Exhibit 10.7 to Form 10-Q for the quarter ended April 1, 2006)* |
| | | | Amended and Restated Tenth Supplemental Annual Benefit Determination under the Amended and Restated Supplemental Executive Retirement Plan for Participants in VF’s Mid-Term Incentive Plan (Incorporated by reference to Exhibit 10.8 to Form 10-Q for the quarter ended April 1, 2006)* |
| | | | Eleventh Supplemental Annual Benefit Determination Pursuant to the Amended and Restated Supplemental Executive Retirement Plan (Incorporated by reference to Exhibit 10.9 to Form 10-Q for the quarter ended April 1, 2006)* |
| | | | Twelfth Supplemental Benefit Determination Pursuant to the VF Corporation Amended and Restated Supplemental Executive Retirement Plan (Incorporated by reference to Exhibit 10.1 to Form 10-Q for the quarter ended September 27, 2014)* |
| | | | Amended and Restated Supplemental Executive Retirement Plan (Incorporated by reference to Exhibit 10.10 to Form 10-Q for the quarter ended April 1, 2006)* |
| | | | Resolution of the Board of Directors dated December 3, 1996 relating to lump sum payments under VF’s Supplemental Executive Retirement Plan (Incorporated by reference to Exhibit 10(N) to Form 10-K for the year ended January 4, 1997)* |
| | | | Form of Change in Control Agreement with Certain Senior Management of VF or its Subsidiaries (Incorporated by reference to Exhibit 10.1 to Form 8-K filed October 21, 2008)* |
| | | | 2012 Form of Change in Control Agreement with Certain Senior Management of VF or its Subsidiaries (Incorporated by reference to Exhibit 10(W) to Form 10-K for the year ended December 31, 2011)* |
VF Corporation Fiscal 2019 Form 10-K 57
|
| | | | |
NUMBER | DESCRIPTION |
| | |
| | | | Amended and Restated Executive Incentive Compensation Plan (Incorporated by reference to Exhibit 10.1 to Form 8-K filed April 25, 2013)* |
| | | | Amended and Restated Management Incentive Compensation Plan (Incorporated by reference to Exhibit 10(BB) to Form 10-K for the year ended December 30, 2017)* |
| | | | VF Corporation Deferred Savings Plan for Non-Employee Directors (Incorporated by reference to Exhibit 10(W) to Form 10-K for the year ended January 3, 2009)* |
| | | | Form of Indemnification Agreement with each of VF’s Non-Employee Directors (Incorporated by reference to Exhibit 10.2 of the Form 10-Q for the quarter ended September 27, 2008)* |
| | | | 2004 Mid-Term Incentive Plan, a subplan under the 1996 Stock Compensation Plan, as amended and restated as of October 18, 2017 (Incorporated by reference to Exhibit 10.1 to form 10-Q for the quarter ended September 30, 2017)* |
| | | | Five-year Revolving Credit Agreement, dated December 17, 2018 (Incorporated by reference to Exhibit 10.1 to Form 10-Q filed February 4, 2019) |
| | | | Separation and Distribution Agreement dated May 22, 2019 (incorporated by reference to Exhibit 2.1 to Form 8-K filed May 23, 2019) |
| | | | Tax Matters Agreement dated May 22, 2019 (incorporated by reference to Exhibit 10.1 to Form 8-K filed May 23, 2019) |
| | | | Transition Services Agreement dated May 22, 2019 (incorporated by reference to Exhibit 10.2 to Form 8-K filed May 23, 2019) |
| | | | VF Intellectual Property License Agreement dated May 17, 2019 (incorporated by reference to Exhibit 10.3 to Form 8-K filed May 23, 2019) |
| | | | Kontoor Intellectual Property License Agreement dated May 17, 2019 (incorporated by reference to Exhibit 10.4 to Form 8-K filed May 23, 2019) |
| | | | Employee Matters Agreement dated May 22, 2019 (incorporated by reference to Exhibit 10.5 to Form 8-K filed May 23, 2019) |
| | * | | Management compensation plans |
| Code of Business Conduct (Incorporated by reference to Exhibit 14 to Form 10-K for the year ended December 30, 2017) The VF Corporation Code of Business Conduct is also available on VF’s website at www.vfc.com. A copy of the Code of Business Conduct will be provided free of charge to any person upon request directed to the Secretary of VF Corporation, at P.O. Box 21488, Greensboro, NC 27420. |
| Subsidiaries of the Corporation |
| Consent of independent registered public accounting firm |
| Power of attorney |
| Certification of the principal executive officer, Steven E. Rendle, pursuant to Section 302 of the Sarbanes-Oxley Act of 2002 |
| Certification of the principal financial officer, Scott A. Roe, pursuant to Section 302 of the Sarbanes-Oxley Act of 2002 |
| Certification of the chief executive officer, Steven E. Rendle, pursuant to 18 U.S.C. Section 1350, as adopted pursuant to Section 906 of the Sarbanes-Oxley Act of 2002 |
| Certification of the chief financial officer, Scott A. Roe, pursuant to 18 U.S.C. Section 1350, as adopted pursuant to Section 906 of the Sarbanes-Oxley Act of 2002 |
101.INS | XBRL Instance Document |
101.SCH | XBRL Taxonomy Extension Schema Document |
101.CAL | XBRL Taxonomy Extension Calculation Linkbase Document |
101.DEF | XBRL Taxonomy Extension Definition Linkbase Document |
101.LAB | XBRL Taxonomy Extension Label Linkbase Document |
101.PRE | XBRL Taxonomy Extension Presentation Linkbase Document |
All other exhibits for which provision is made in the applicable regulations of the Securities and Exchange Commission are not required under the related instructions or are inapplicable and therefore have been omitted.
† The schedules to these agreements are omitted pursuant to Item 601(b)(2) of Regulation S-K. The Company agrees to supplementary furnish to the Securities and Exchange Commission, upon request, a copy of any omitted schedule.
|
|
ITEM 16. FORM 10-K SUMMARY. |
None.
58 VF Corporation Fiscal 2019 Form 10-K
SIGNATURES
Pursuant to the requirements of Section 13 or 15(d) of the Securities Exchange Act of 1934, VF has duly caused this report to be signed on its behalf by the undersigned, thereunto duly authorized.
|
| | |
V.F. CORPORATION |
| |
By: | | /s/ Steven E. Rendle |
| | Steven E. Rendle Chairman, President and Chief Executive Officer (Principal Executive Officer and Director) |
| |
By: | | /s/ Scott A. Roe |
| | Scott A. Roe Executive Vice President and Chief Financial Officer (Principal Financial Officer) |
| |
By: | | /s/ Bryan H. McNeill |
| | Bryan H. McNeill Vice President, Controller and Chief Accounting Officer (Principal Accounting Officer) |
May 24, 2019
Pursuant to the requirements of the Securities Exchange Act of 1934, this report has been signed below by the following persons on behalf of VF and in the capacities and on the dates indicated:
|
| | |
Richard T. Carucci* | | Director |
| |
Juliana L. Chugg* | | Director |
| |
Benno O. Dorer* | | Director |
| |
Mark S. Hoplamazian* | | Director |
| |
Laura W. Lang* | | Director |
| |
W. Alan McCollough* | | Director |
| |
W. Rodney McMullen* | | Director |
| |
Clarence Otis, Jr.* | | Director |
| |
Steven E. Rendle* | | Director |
| |
Carol L. Roberts* | | Director |
| |
Matthew J. Shattock* | | Director |
| |
Veronica Wu* | | Director |
|
| | |
| |
*By: | | /s/ Laura C. Meagher |
| | Laura C. Meagher, Attorney-in-Fact |
May 24, 2019
VF Corporation Fiscal 2019 Form 10-K 59
VF CORPORATION
Index to Consolidated Financial Statements
and Financial Statement Schedule
March 2019
VF Corporation Fiscal 2019 Form 10-K F-1
VF Corporation
Management’s Report on Internal Control Over Financial Reporting
Management of VF Corporation (“VF”) is responsible for establishing and maintaining adequate internal control over financial reporting, as defined in Exchange Act Rule 13a-15(f). VF’s management conducted an assessment of VF's internal control over financial reporting based on the framework described in Internal Control — Integrated Framework (2013), issued by the Committee of Sponsoring Organizations of the Treadway Commission. Based on this assessment, VF’s management has determined that VF’s internal control over financial reporting was effective as of March 30, 2019.
The effectiveness of VF’s internal control over financial reporting as of March 30, 2019 has been audited by PricewaterhouseCoopers LLP, an independent registered public accounting firm, as stated in their report which appears herein.
F-2 VF Corporation Fiscal 2019 Form 10-K
Report of Independent Registered Public Accounting Firm
To the Board of Directors and Stockholders of V. F. Corporation
Opinions on the Financial Statements and Internal Control over Financial Reporting
We have audited the accompanying consolidated balance sheets of V. F. Corporation and its subsidiaries (the “Company”) as of March 30, 2019, March 31, 2018 and December 30, 2017, and the related consolidated statements of income, comprehensive income, stockholders’ equity and cash flows for the year ended March 30, 2019, for the three months ended March 31, 2018 and for the years ended December 30, 2017 and December 31, 2016, including the related notes and the accompanying schedule of valuation and qualifying accounts for the year ended March 30, 2019, for the three months ended March 31, 2018 and for the years ended December 30, 2017 and December 31, 2016 (collectively referred to as the “consolidated financial statements”). We also have audited the Company's internal control over financial reporting as of March 30, 2019, based on criteria established in Internal Control - Integrated Framework (2013) issued by the Committee of Sponsoring Organizations of the Treadway Commission (COSO).
In our opinion, the consolidated financial statements referred to above present fairly, in all material respects, the financial position of the Company as of March 30, 2019, March 31, 2018 and December 30, 2017, and the results of its operations and its cash flows for the year ended March 30, 2019, for the three months ended March 31, 2018 and for the years ended December 30, 2017 and December 31, 2016 in conformity with accounting principles generally accepted in the United States of America. Also in our opinion, the Company maintained, in all material respects, effective internal control over financial reporting as of March 30, 2019, based on criteria established in Internal Control - Integrated Framework (2013) issued by the COSO.
Change in Accounting Principle
As discussed in Note 1 to the consolidated financial statements, the Company changed the manner in which it accounts for the recognition of current and deferred income taxes for intra-entity asset transfers in the year ended December 30, 2017 and the manner in which it accounts for net periodic pension cost and the manner in which it accounts for revenues from contracts with customer in the year ended March 30, 2019.
Basis for Opinions
The Company's management is responsible for these consolidated financial statements, for maintaining effective internal control over financial reporting, and for its assessment of the effectiveness of internal control over financial reporting, included in the accompanying Management’s Report on Internal Control over Financial Reporting. Our responsibility is to express opinions on the Company’s consolidated financial statements and on the Company's internal control over financial reporting based on our audits. We are a public accounting firm registered with the Public Company Accounting Oversight Board (United States) (PCAOB) and are required to be independent with respect to the Company in accordance with the U.S. federal securities laws and the applicable rules and regulations of the Securities and Exchange Commission and the PCAOB.
We conducted our audits in accordance with the standards of the PCAOB. Those standards require that we plan and perform the audits to obtain reasonable assurance about whether the consolidated financial statements are free of material misstatement, whether due to error or fraud, and whether effective internal control over financial reporting was maintained in all material respects.
Our audits of the consolidated financial statements included performing procedures to assess the risks of material misstatement of the consolidated financial statements, whether due to error or fraud, and performing procedures that respond to those risks. Such procedures included examining, on a test basis, evidence regarding the amounts and disclosures in the consolidated financial statements. Our audits also included evaluating the accounting principles used and significant estimates made by management, as well as evaluating the overall presentation of the consolidated financial statements. Our audit of internal control over financial reporting included obtaining an understanding of internal control over financial reporting, assessing the risk that a material weakness exists, and testing and evaluating the design and operating effectiveness of internal control based on the assessed risk. Our audits also included performing such other procedures as we considered necessary in the circumstances. We believe that our audits provide a reasonable basis for our opinions.
Definition and Limitations of Internal Control over Financial Reporting
A company’s internal control over financial reporting is a process designed to provide reasonable assurance regarding the reliability of financial reporting and the preparation of financial statements for external purposes in accordance with generally accepted accounting principles. A company’s internal control over financial reporting includes those policies and procedures that (i) pertain to the maintenance of records that, in reasonable detail, accurately and fairly reflect the transactions and dispositions of the assets of the company; (ii) provide reasonable assurance that transactions are recorded as necessary to permit preparation of financial statements in accordance with generally accepted accounting principles, and that receipts and expenditures of the company are being made only in accordance with authorizations of management and directors of the company; and (iii) provide reasonable assurance regarding prevention or timely detection of unauthorized acquisition, use, or disposition of the company’s assets that could have a material effect on the financial statements.
VF Corporation Fiscal 2019 Form 10-K F-3
Because of its inherent limitations, internal control over financial reporting may not prevent or detect misstatements. Also, projections of any evaluation of effectiveness to future periods are subject to the risk that controls may become inadequate because of changes in conditions, or that the degree of compliance with the policies or procedures may deteriorate.
/s/ PricewaterhouseCoopers LLP
Greensboro, North Carolina
May 24, 2019
We have served as the Company’s auditor since 1995.
F-4 VF Corporation Fiscal 2019 Form 10-K
VF CORPORATION
Consolidated Balance Sheets
|
| | | | | | | | | | | | | |
(In thousands, except share amounts) | | March 2019 | | | March 2018 | | December 2017 |
ASSETS | | | | | | | |
Current assets | | | | | | | |
Cash and equivalents | | $ | 543,011 |
| | | $ | 680,762 |
| | $ | 563,483 |
|
Accounts receivable, less allowance for doubtful accounts of: March 2019 - $28,376; March 2018 - $24,993; December 2017 - $26,266 | | 1,708,796 |
| | | 1,408,587 |
| | 1,429,986 |
|
Inventories | | 1,943,030 |
| | | 1,861,441 |
| | 1,706,609 |
|
Other current assets | | 478,620 |
| | | 358,953 |
| | 296,986 |
|
Current assets of discontinued operations | | — |
| | | 373,580 |
| | 380,700 |
|
Total current assets | | 4,673,457 |
| | | 4,683,323 |
| | 4,377,764 |
|
Property, plant and equipment, net | | 1,057,268 |
| | | 1,011,617 |
| | 1,014,638 |
|
Intangible assets, net | | 2,024,277 |
| | | 2,120,110 |
| | 2,089,781 |
|
Goodwill | | 1,754,884 |
| | | 1,693,219 |
| | 1,692,644 |
|
Other assets | | 846,899 |
| | | 803,041 |
| | 783,675 |
|
TOTAL ASSETS | | $ | 10,356,785 |
| | | $ | 10,311,310 |
| | $ | 9,958,502 |
|
LIABILITIES AND STOCKHOLDERS’ EQUITY | | | | | | | |
Current liabilities | | | | | | | |
Short-term borrowings | | $ | 665,055 |
| | | $ | 1,525,106 |
| | $ | 729,384 |
|
Current portion of long-term debt | | 5,263 |
| | | 6,265 |
| | 6,165 |
|
Accounts payable | | 694,733 |
| | | 583,004 |
| | 760,997 |
|
Accrued liabilities | | 1,296,553 |
| | | 938,427 |
| | 1,146,535 |
|
Current liabilities of discontinued operations | | — |
| | | 86,027 |
| | 101,019 |
|
Total current liabilities | | 2,661,604 |
| | | 3,138,829 |
| | 2,744,100 |
|
Long-term debt | | 2,115,884 |
| | | 2,212,555 |
| | 2,187,789 |
|
Other liabilities | | 1,280,781 |
| | | 1,271,830 |
| | 1,306,713 |
|
Commitments and contingencies | |
| | |
| |
|
Total liabilities | | 6,058,269 |
| | | 6,623,214 |
| | 6,238,602 |
|
Stockholders' equity | | | | | | | |
Preferred Stock, par value $1; shares authorized, 25,000,000; no shares outstanding at March 2019, March 2018 or December 2017 | | — |
| | | — |
| | — |
|
Common Stock, stated value $0.25; shares authorized, 1,200,000,000; shares outstanding at March 2019 - 396,824,662; March 2018 - 394,313,070; December 2017 - 395,821,781 | | 99,206 |
| | | 98,578 |
| | 98,955 |
|
Additional paid-in capital | | 3,921,784 |
| | | 3,607,424 |
| | 3,523,340 |
|
Accumulated other comprehensive income (loss) | | (902,075 | ) | | | (864,030 | ) | | (926,140 | ) |
Retained earnings | | 1,179,601 |
| | | 846,124 |
| | 1,023,745 |
|
Total stockholders’ equity | | 4,298,516 |
| | | 3,688,096 |
| | 3,719,900 |
|
TOTAL LIABILITIES AND STOCKHOLDERS' EQUITY | | $ | 10,356,785 |
| | | $ | 10,311,310 |
| | $ | 9,958,502 |
|
See notes to consolidated financial statements.
VF Corporation Fiscal 2019 Form 10-K F-5
VF CORPORATION
Consolidated Statements of Income
|
| | | | | | | | | | | | | | | | | |
| | Year Ended March | | | Three Months Ended March (Transition Period) | | Year Ended December |
(In thousands, except per share amounts) | | 2019 | | | 2018 | | 2017 | | 2016 |
Net revenues | | $ | 13,848,660 |
| | | $ | 3,045,446 |
| | $ | 11,811,177 |
| | $ | 11,026,147 |
|
Costs and operating expenses | | | | |
| | | | |
Cost of goods sold | | 6,827,481 |
| | | 1,506,335 |
| | 5,844,941 |
| | 5,589,923 |
|
Selling, general and administrative expenses | | 5,345,339 |
| | | 1,229,046 |
| | 4,453,207 |
| | 3,901,122 |
|
Impairment of goodwill and intangible assets | | — |
| | | — |
| | — |
| | 79,644 |
|
Total costs and operating expenses | | 12,172,820 |
| | | 2,735,381 |
| | 10,298,148 |
| | 9,570,689 |
|
Operating income | | 1,675,840 |
| | | 310,065 |
| | 1,513,029 |
| | 1,455,458 |
|
Interest income | | 22,643 |
| | | 3,228 |
| | 16,095 |
| | 9,176 |
|
Interest expense | | (108,068 | ) | | | (24,393 | ) | | (101,975 | ) | | (94,722 | ) |
Other income (expense), net | | (63,011 | ) | | | 5,233 |
| | (10,654 | ) | | (85,196 | ) |
Income from continuing operations before income taxes | | 1,527,404 |
| | | 294,133 |
| | 1,416,495 |
| | 1,284,716 |
|
Income taxes | | 268,400 |
| | | 32,969 |
| | 695,286 |
| | 205,862 |
|
Income from continuing operations | | 1,259,004 |
| | | 261,164 |
| | 721,209 |
| | 1,078,854 |
|
Income (loss) from discontinued operations, net of tax | | 788 |
| | | (8,371 | ) | | (106,286 | ) | | (4,748 | ) |
Net income | | $ | 1,259,792 |
| | | $ | 252,793 |
| | $ | 614,923 |
| | $ | 1,074,106 |
|
Earnings (loss) per common share - basic | | | | |
| | | | |
Continuing operations | | $ | 3.19 |
| | | $ | 0.66 |
| | $ | 1.81 |
| | $ | 2.59 |
|
Discontinued operations | | — |
| | | (0.02 | ) | | (0.27 | ) | | (0.01 | ) |
Total earnings per common share - basic | | $ | 3.19 |
| | | $ | 0.64 |
| | $ | 1.54 |
| | $ | 2.58 |
|
Earnings (loss) per common share - diluted | | | | |
|
| | | | |
Continuing operations | | $ | 3.14 |
| | | $ | 0.65 |
| | $ | 1.79 |
| | $ | 2.56 |
|
Discontinued operations | | — |
| | | (0.02 | ) | | (0.26 | ) | | (0.01 | ) |
Total earnings per common share - diluted | | $ | 3.15 |
| | | $ | 0.63 |
| | $ | 1.52 |
| | $ | 2.54 |
|
Weighted average shares outstanding | | | | | | | | | |
Basic | | 395,189 |
| | | 395,253 |
| | 399,223 |
| | 416,103 |
|
Diluted | | 400,496 |
| | | 401,276 |
| | 403,559 |
| | 422,081 |
|
See notes to consolidated financial statements.
F-6 VF Corporation Fiscal 2019 Form 10-K
VF CORPORATION
Consolidated Statements of Comprehensive Income
|
| | | | | | | | | | | | | | | | | |
| | Year Ended March | | | Three Months Ended March (Transition Period) | | Year Ended December |
(In thousands) | | 2019 | | | 2018 | | 2017 | | 2016 |
Net income | | $ | 1,259,792 |
| | | $ | 252,793 |
| | $ | 614,923 |
| | $ | 1,074,106 |
|
Other comprehensive income (loss) | | | | |
| | | | |
Foreign currency translation and other | | | | |
| | | | |
Gains (losses) arising during the period | | (225,295 | ) | | | 62,978 |
| | 202,428 |
| | (52,028 | ) |
Income tax effect | | (23,515 | ) | | | 6,354 |
| | 45,950 |
| | (24,382 | ) |
Defined benefit pension plans | | | | |
| | | | |
Current period actuarial gains (losses), including plan amendments and curtailments | | 15,198 |
| | | (6,405 | ) | | (19,801 | ) | | (5,384 | ) |
Amortization of net deferred actuarial losses | | 28,474 |
| | | 8,548 |
| | 41,440 |
| | 65,212 |
|
Amortization of deferred prior service costs | | 494 |
| | | 647 |
| | 2,646 |
| | 2,584 |
|
Reclassification of net actuarial loss from settlement charge | | 8,856 |
| | | — |
| | — |
| | 50,922 |
|
Reclassification of deferred prior service cost due to curtailments | | 9,530 |
| | | — |
| | 1,671 |
| | — |
|
Income tax effect | | (16,118 | ) | | | (459 | ) | | (15,208 | ) | | (43,836 | ) |
Derivative financial instruments | | | | |
| | | | |
Gains (losses) arising during period | | 156,513 |
| | | (25,530 | ) | | (138,716 | ) | | 90,708 |
|
Income tax effect | | (19,295 | ) | | | 4,452 |
| | 15,636 |
| | (9,672 | ) |
Reclassification to net income for (gains) losses realized | | 28,341 |
| | | 13,960 |
| | (24,067 | ) | | (107,457 | ) |
Income tax effect | | (1,228 | ) | | | (2,435 | ) | | 3,344 |
| | 35,092 |
|
Other comprehensive income (loss) | | (38,045 | ) | | | 62,110 |
| | 115,323 |
| | 1,759 |
|
Comprehensive income | | $ | 1,221,747 |
| | | $ | 314,903 |
| | $ | 730,246 |
| | $ | 1,075,865 |
|
See notes to consolidated financial statements.
VF Corporation Fiscal 2019 Form 10-K F-7
VF CORPORATION
Consolidated Statements of Cash Flows
|
| | | | | | | | | | | | | | | | | |
| | Year Ended March | | | Three Months
Ended March
(Transition Period) | | Year Ended December |
(In thousands) | | 2019 (a) | | | 2018 (a) | | 2017 (a) | | 2016 (a) |
OPERATING ACTIVITIES | | | | | | | | | |
Net income | | $ | 1,259,792 |
| | | $ | 252,793 |
| | $ | 614,923 |
| | $ | 1,074,106 |
|
Adjustments to reconcile net income to cash provided (used) by operating activities: | | | | |
| | | | |
Impairment of goodwill and intangible assets | | — |
| | | — |
| | 104,651 |
| | 79,644 |
|
Depreciation and amortization | | 301,005 |
| | | 71,532 |
| | 290,503 |
| | 281,577 |
|
Stock-based compensation | | 105,157 |
| | | 25,440 |
| | 81,641 |
| | 67,762 |
|
Provision for doubtful accounts | | 22,553 |
| | | 2,660 |
| | 21,171 |
| | 17,283 |
|
Pension expense (less than) in excess of contributions | | (1,850 | ) | | | 1,413 |
| | 25,022 |
| | 89,005 |
|
Deferred income taxes | | (62,901 | ) | | | 303 |
| | (79,838 | ) | | (71,625 | ) |
Loss on sale of businesses | | 28,262 |
| | | 18,065 |
| | 29,841 |
| | 104,357 |
|
Other, net | | (31,612 | ) | | | (7,148 | ) | | (2,006 | ) | | (15,232 | ) |
Changes in operating assets and liabilities: | | | | |
| | | | |
Accounts receivable | | (373,012 | ) | | | 38,686 |
| | (107,083 | ) | | 47,102 |
|
Inventories | | (135,099 | ) | | | (156,292 | ) | | 17,005 |
| | (37,210 | ) |
Accounts payable | | 111,678 |
| | | (187,553 | ) | | 21,494 |
| | (9,553 | ) |
Income taxes | | (19,974 | ) | | | (65,234 | ) | | 460,350 |
| | (129,574 | ) |
Accrued liabilities | | 484,858 |
| | | (172,396 | ) | | 31,928 |
| | 28,904 |
|
Other assets and liabilities | | (24,634 | ) | | | (65,492 | ) | | (34,942 | ) | | (45,978 | ) |
Cash provided (used) by operating activities | | 1,664,223 |
| | | (243,223 | ) | | 1,474,660 |
| | 1,480,568 |
|
INVESTING ACTIVITIES | | | | |
| | | | |
Business acquisitions, net of cash received | | (320,405 | ) | | | — |
| | (740,541 | ) | | — |
|
Proceeds from sale of businesses, net of cash sold | | 430,286 |
| | | — |
| | 214,968 |
| | 115,983 |
|
Capital expenditures | | (250,634 | ) | | | (54,374 | ) | | (169,553 | ) | | (175,840 | ) |
Software purchases | | (56,207 | ) | | | (19,289 | ) | | (65,177 | ) | | (44,226 | ) |
Other, net | | (23,672 | ) | | | 17,673 |
| | (15,948 | ) | | (8,331 | ) |
Cash used by investing activities | | (220,632 | ) | | | (55,990 | ) | | (776,251 | ) | | (112,414 | ) |
FINANCING ACTIVITIES | | | | |
| | | | |
Net (decrease) increase in short-term borrowings | | (864,177 | ) | | | 795,908 |
| | 686,453 |
| | (421,069 | ) |
Payments on long-term debt | | (6,264 | ) | | | (1,484 | ) | | (254,314 | ) | | (13,276 | ) |
Payment of debt issuance costs | | (2,123 | ) | | | — |
| | — |
| | (6,807 | ) |
Proceeds from long-term debt | | — |
| | | — |
| | — |
| | 951,817 |
|
Purchases of treasury stock | | (150,676 | ) | | | (250,282 | ) | | (1,200,356 | ) | | (1,000,468 | ) |
Cash dividends paid | | (767,061 | ) | | | (181,373 | ) | | (684,679 | ) | | (635,994 | ) |
Proceeds from issuance of Common Stock, net of shares withheld for taxes | | 199,296 |
| | | 44,017 |
| | 89,893 |
| | 48,918 |
|
Cash (used) provided by financing activities | | (1,591,005 | ) | | | 406,786 |
| | (1,363,003 | ) | | (1,076,879 | ) |
Effect of foreign currency rate changes on cash, cash equivalents and restricted cash | | 14,811 |
| | | 12,220 |
| | 2,965 |
| | (6,645 | ) |
Net change in cash, cash equivalents and restricted cash | | (132,603 | ) | | | 119,793 |
| | (661,629 | ) | | 284,630 |
|
Cash, cash equivalents and restricted cash — beginning of period | | 689,190 |
| | | 569,397 |
| | 1,231,026 |
| | 946,396 |
|
Cash, cash equivalents and restricted cash — end of period | | $ | 556,587 |
| | | $ | 689,190 |
| | $ | 569,397 |
| | $ | 1,231,026 |
|
| | | | | | | | | |
Balances per Consolidated Balance Sheets: | |
|
| | | | |
|
| |
|
|
Cash and cash equivalents | | $ | 543,011 |
| | | $ | 680,762 |
| | $ | 563,483 |
| | $ | 1,224,975 |
|
Other current assets | | 3,645 |
| | | 3,804 |
| | 2,452 |
| | 2,469 |
|
Current assets of discontinued operations | | — |
| | | 2,330 |
| | 2,592 |
| | 2,887 |
|
Other assets | | 9,931 |
| | | 2,294 |
| | 870 |
| | 695 |
|
Total cash, cash equivalents and restricted cash | | $ | 556,587 |
| | | $ | 689,190 |
| | $ | 569,397 |
| | $ | 1,231,026 |
|
(a) The cash flows related to discontinued operations have not been segregated, and remain included in the major classes of assets and liabilities. Accordingly, the Consolidated Statements of Cash Flows include the results of continuing and discontinued operations.
See notes to consolidated financial statements.
F-8 VF Corporation Fiscal 2019 Form 10-K
VF CORPORATION
Consolidated Statements of Stockholders' Equity
|
| | | | | | | | | | | | | | | | | | | | | | | |
| Common Stock | | Additional Paid-in Capital | | Accumulated Other Comprehensive Income (Loss) | | Retained Earnings | | Total | |
(In thousands, except share amounts) | Shares | | Amounts | |
Balance, December 2015 | 426,614,274 |
| | $ | 106,654 |
| | $ | 3,192,675 |
| | $ | (1,043,222 | ) | | $ | 3,128,731 |
| | $ | 5,384,838 |
| |
Net income | — |
| | — |
| | — |
| | — |
| | 1,074,106 |
| | 1,074,106 |
| |
Dividends on Common Stock ($1.53 per share) | — |
| | — |
| | — |
| | — |
| | (635,994 | ) | | (635,994 | ) | |
Purchase of treasury stock | (15,932,075 | ) | | (3,983 | ) | | — |
| | — |
| | (996,485 | ) | | (1,000,468 | ) | |
Stock-based compensation, net | 3,330,755 |
| | 832 |
| | 140,748 |
| | — |
| | (24,900 | ) | | 116,680 |
| |
Foreign currency translation and other | — |
| | — |
| | — |
| | (76,410 | ) | | — |
| | (76,410 | ) | |
Defined benefit pension plans | — |
| | — |
| | — |
| | 69,498 |
| | — |
| | 69,498 |
| |
Derivative financial instruments | — |
| | — |
| | — |
| | 8,671 |
| | — |
| | 8,671 |
| |
Balance, December 2016 | 414,012,954 |
| | 103,503 |
| | 3,333,423 |
| | (1,041,463 | ) | | 2,545,458 |
| | 4,940,921 |
| |
Adoption of new accounting standard | — |
| | — |
| |
|
| | — |
| | (237,764 | ) | | (237,764 | ) | |
Net income | — |
| | — |
| | — |
| | — |
| | 614,923 |
| | 614,923 |
| |
Dividends on Common Stock ($1.72 per share) | — |
| | — |
| | — |
| | — |
| | (684,679 | ) | | (684,679 | ) | |
Purchase of treasury stock | (22,213,162 | ) | | (5,553 | ) | | — |
| | — |
| | (1,194,803 | ) | | (1,200,356 | ) | |
Stock-based compensation, net | 4,021,989 |
| | 1,005 |
| | 189,917 |
| | — |
| | (19,390 | ) | | 171,532 |
| |
Foreign currency translation and other | — |
| | — |
| | — |
| | 248,378 |
| | — |
| | 248,378 |
| |
Defined benefit pension plans | — |
| | — |
| | — |
| | 10,748 |
| | — |
| | 10,748 |
| |
Derivative financial instruments | — |
| | — |
| | — |
| | (143,803 | ) | | — |
| | (143,803 | ) | |
Balance, December 2017 | 395,821,781 |
| | 98,955 |
| | 3,523,340 |
| | (926,140 | ) | | 1,023,745 |
| | 3,719,900 |
| |
Beginning balance adjustment (Note 1) | — |
| | — |
| | — |
| | — |
| | 15,492 |
| | 15,492 |
| |
Net income | — |
| | — |
| | — |
| | — |
| | 252,793 |
| | 252,793 |
| |
Dividends on Common Stock ($0.46 per share) | — |
| | — |
| | — |
| | — |
| | (181,373 | ) | | (181,373 | ) | |
Purchase of treasury stock | (3,361,101 | ) | | (840 | ) | | — |
| | — |
| | (249,442 | ) | | (250,282 | ) | |
Stock-based compensation, net | 1,852,390 |
| | 463 |
| | 84,084 |
| | — |
| | (15,091 | ) | | 69,456 |
| |
Foreign currency translation and other | — |
| | — |
| | — |
| | 69,332 |
| | — |
| | 69,332 |
| |
Defined benefit pension plans | — |
| | — |
| | — |
| | 2,331 |
| | — |
| | 2,331 |
| |
Derivative financial instruments | — |
| | — |
| | — |
| | (9,553 | ) | | — |
| | (9,553 | ) | |
Balance, March 2018 | 394,313,070 |
| | 98,578 |
| | 3,607,424 |
| | (864,030 | ) | | 846,124 |
| | 3,688,096 |
| |
Adoption of new accounting standard | — |
| | — |
| | — |
| | — |
| | 1,956 |
| | 1,956 |
| |
Net income | — |
| | — |
| | — |
| | — |
| | 1,259,792 |
| | 1,259,792 |
| |
Dividends on Common Stock ($1.94 per share) | — |
| | — |
| | — |
| | — |
| | (767,061 | ) | | (767,061 | ) | |
Purchase of treasury stock | (1,868,934 | ) | | (467 | ) | | — |
| | — |
| | (150,209 | ) | | (150,676 | ) | |
Stock-based compensation, net | 4,380,526 |
| | 1,095 |
| | 314,360 |
| | — |
| | (11,001 | ) | | 304,454 |
| |
Foreign currency translation and other | — |
| | — |
| | — |
| | (248,810 | ) | | — |
| | (248,810 | ) | |
Defined benefit pension plans | — |
| | — |
| | — |
| | 46,434 |
| | — |
| | 46,434 |
| |
Derivative financial instruments | — |
| | — |
| | — |
| | 164,331 |
| | — |
| | 164,331 |
| |
Balance, March 2019 | 396,824,662 |
| | $ | 99,206 |
| | $ | 3,921,784 |
| | $ | (902,075 | ) | | $ | 1,179,601 |
| | $ | 4,298,516 |
| |
See notes to consolidated financial statements.
VF Corporation Fiscal 2019 Form 10-K F-9
VF CORPORATION
Notes to Consolidated Financial Statements
March 2019
NOTE 1 — SUMMARY OF SIGNIFICANT ACCOUNTING POLICIES
Description of Business
VF Corporation (together with its subsidiaries, collectively known as “VF” or the "Company”) is a global apparel and footwear company based in the United States. VF designs, produces, procures, markets and distributes a variety of branded lifestyle products, including outerwear, footwear, occupational and performance apparel, jeanswear, backpacks and luggage for consumers of all ages. Products are marketed primarily under VF-owned brand names.
Basis of Presentation
The consolidated financial statements and related disclosures are presented in accordance with generally accepted accounting principles in the U.S (“GAAP”). The consolidated financial statements include the accounts of VF and its controlled subsidiaries, after elimination of intercompany transactions and balances.
The Nautica® brand business, the Licensing Business (which comprised the Licensed Sports Group and JanSport® brand collegiate businesses), and the former Contemporary Brands segment have been reported as discontinued operations in our Consolidated Statements of Income, and the related held-for-sale assets and liabilities have been presented as assets and liabilities of discontinued operations in the Consolidated Balance Sheets, through their dates of disposal. These changes have been applied to all periods presented. Unless otherwise noted, discussion within these notes to the consolidated financial statements relates to continuing operations. Refer to Note 4 for additional information on discontinued operations.
Fiscal Year
VF operates and reports using a 52/53 week fiscal year ending on the Saturday closest to March 31 of each year. VF previously used a 52/53 week fiscal year ending on the Saturday closest to December 31 of each year. VF's current fiscal year ran from April 1, 2018 through March 30, 2019 ("Fiscal 2019"). All references to the periods ended March 2019, December 2017 and December 2016 relate to the 52-week fiscal years ended March 30, 2019, December 30, 2017 and December 31, 2016, respectively. All references to the period ended March 2018 relate to the 13-week transition period ended March 31, 2018. Certain foreign subsidiaries reported using a December 31 year-end for the years ended December 2017 and December 2016, and using a March 31 year-end for Fiscal 2019 due to local statutory requirements. The impact to VF's consolidated financial statements is not material.
Use of Estimates
In preparing the consolidated financial statements in accordance with GAAP, management makes estimates and assumptions that affect amounts reported in the consolidated financial statements and accompanying notes. Actual results may differ from those estimates.
Foreign Currency Translation and Transaction
The financial statements of most foreign subsidiaries are measured using the foreign currency as the functional currency. Assets and liabilities denominated in a foreign currency are translated into U.S. dollars using exchange rates in effect at the
balance sheet date, and revenues and expenses are translated at average exchange rates during the period. Resulting translation gains and losses, and transaction gains and losses on long-term advances to foreign subsidiaries, are reported in other comprehensive income (loss) (“OCI”).
Foreign currency transactions are denominated in a currency other than the functional currency of a particular entity. These transactions generally result in receivables or payables that are fixed in the foreign currency. Transaction gains or losses arise when exchange rate fluctuations either increase or decrease the functional currency cash flows from the originally recorded transaction. As discussed in Note 23, VF enters into derivative contracts to manage foreign currency risk on certain of these transactions. Foreign currency transaction gains and losses reported in the Consolidated Statements of Income, net of the related hedging losses and gains, were a loss of $15.5 million in the year ended March 2019, a gain of $6.8 million in the three months ended March 2018, a gain of $4.8 million in the year ended December 2017 and a loss of $9.7 million in the year ended December 2016.
Cash and Equivalents
Cash and equivalents are demand deposits, receivables from third-party credit card processors, and highly liquid investments that mature within three months of their purchase dates. Cash equivalents totaling $256.8 million, $192.8 million and $279.0 million at March 2019, March 2018 and December 2017, respectively, consist of money market funds and short-term time deposits.
Accounts Receivable
Upon adoption of the new revenue recognition accounting standard in Fiscal 2019 (see "Recently Adopted Accounting Standards" section below), trade accounts receivable are recorded at invoiced amounts, less contractual allowances for trade terms, sales incentive programs and discounts. Prior to the adoption of the new revenue recognition accounting standard, trade accounts receivable were recorded at invoiced amounts, less estimated allowances for trade terms, sales incentive programs, discounts, markdowns, chargebacks and returns as discussed below in the "Revenue Recognition" section. Royalty receivables are recorded at amounts earned based on the licensees’ sales of licensed products, subject in some cases to contractual minimum royalties due from individual licensees. VF maintains an allowance for doubtful accounts for estimated losses that will result from the inability of customers and licensees to make required payments. The allowance is determined based on review of specific customer accounts where collection is doubtful, as well as an assessment of the collectability of total receivables considering the aging of balances, historical and anticipated trends, and current economic conditions. All accounts are subject to ongoing review of ultimate collectability. Receivables are written off against the allowance when it is probable the amounts will not be recovered.
Inventories
Inventories are stated at the lower of cost or net realizable value. Cost is determined on the first-in, first-out (“FIFO”) method and is net of discounts or rebates received from vendors.
F-10 VF Corporation Fiscal 2019 Form 10-K
VF CORPORATION
Notes to Consolidated Financial Statements
March 2019
Long-lived Assets, Including Intangible Assets and Goodwill
Property, plant and equipment, intangible assets and goodwill are initially recorded at cost. VF capitalizes improvements to property, plant and equipment that substantially extend the useful life of the asset, and interest cost incurred during construction of major assets. Assets under capital leases are recorded at the present value of minimum lease payments. Repair and maintenance costs are expensed as incurred.
Cost for acquired intangible assets represents the fair value at acquisition date, which is generally based on the present value of expected cash flows. Trademark intangible assets represent individual acquired trademarks, some of which are registered in multiple countries. Customer relationship intangible assets are based on the value of relationships with wholesale customers in place at the time of acquisition. License intangible assets relate to VF's licensing contracts with customers.
Goodwill represents the excess of cost of an acquired business over the fair value of net tangible assets and identifiable intangible assets acquired. Goodwill is assigned at the reporting unit level.
Depreciation of property, plant and equipment is computed using the straight-line method over the estimated useful lives of the assets, ranging from 3 to 10 years for machinery and equipment and up to 40 years for buildings. Amortization expense for leasehold improvements and assets under capital leases is recognized over the shorter of their estimated useful lives or the lease terms, and is included in depreciation expense.
Intangible assets determined to have indefinite lives, consisting of major trademarks and trade names, are not amortized. Other intangible assets, primarily customer relationships, license intangible assets and trademarks determined to have a finite life, are amortized over their estimated useful lives ranging from 3 to 24 years. Amortization of intangible assets is computed using straight-line or accelerated methods consistent with the timing of the expected benefits to be received.
Depreciation and amortization expense related to producing or otherwise obtaining finished goods inventories is included in cost of goods sold, and other depreciation and amortization expense is included in selling, general and administrative expenses.
VF’s policy is to review property, plant and equipment and amortizable intangible assets for possible impairment whenever events or changes in circumstances indicate that the carrying amount of an asset or asset group may not be recoverable. If forecasted undiscounted cash flows to be generated by the asset are not expected to recover the asset’s carrying value, an impairment charge is recorded for the excess of the asset’s carrying value over its estimated fair value.
VF’s policy is to evaluate indefinite-lived intangible assets and goodwill for possible impairment as of the beginning of the fourth quarter of each year, or whenever events or changes in circumstances indicate that the fair value of such assets may be below their carrying amount. VF may first assess qualitative factors as a basis for determining whether it is necessary to perform quantitative impairment testing. If VF determines that it is not more likely than not that the fair value of an asset or reporting unit is less than its carrying value, then no further testing is required. Otherwise, the assets must be quantitatively tested for impairment.
An indefinite-lived intangible asset is quantitatively evaluated for possible impairment by comparing the estimated fair value of the asset with its carrying value. An impairment charge is recorded if the carrying value of the asset exceeds its estimated fair value.
Goodwill is quantitatively evaluated for possible impairment by comparing the estimated fair value of a reporting unit with its carrying value, including the goodwill assigned to that reporting unit. An impairment charge is recorded if the carrying value of the reporting unit exceeds its estimated fair value.
Derivative Financial Instruments
Derivative financial instruments are measured at fair value in the Consolidated Balance Sheets. Unrealized gains and losses are recognized as assets and liabilities, respectively, and classified as current or noncurrent based on the derivatives’ maturity dates. The accounting for changes in the fair value of derivative instruments (i.e., gains and losses) depends on the intended use of the derivative, whether the Company has elected to designate a derivative in a hedging relationship and apply hedge accounting and whether the hedging relationship has satisfied the criteria necessary to apply hedge accounting. To qualify for hedge accounting treatment, all hedging relationships must be formally documented at the inception of the hedges and must be highly effective in offsetting changes to future cash flows of hedged transactions. VF’s hedging practices are described in Note 23. VF does not use derivative instruments for trading or speculative purposes. Hedging cash flows are classified in the Consolidated Statements of Cash Flows in the same category as the items being hedged.
VF formally documents hedging instruments and hedging relationships at the inception of each contract. Further, at the inception of a contract and on an ongoing basis, VF assesses whether the hedging instruments are effective in offsetting the risk of the hedged transactions. Occasionally, a portion of a derivative instrument will be considered ineffective in hedging the originally identified exposure due to a decline in amount or a change in timing of the hedged exposure. In that case, hedge accounting treatment is discontinued for the ineffective portion of that hedging instrument, and any change in fair value for the ineffective portion is recognized in net income.
VF also uses derivative contracts to manage foreign currency exchange risk on certain assets and liabilities, and to hedge the exposure on the foreign currency denominated purchase price of acquisitions. These contracts are not designated as hedges, and are measured at fair value in the Consolidated Balance Sheets with changes in fair value recognized directly in net income.
The counterparties to the derivative contracts are financial institutions having at least A-rated investment grade credit ratings. To manage its credit risk, VF continually monitors the credit risks of its counterparties, limits its exposure in the aggregate and to any single counterparty, and adjusts its hedging positions as appropriate. The impact of VF’s credit risk and the credit risk of its counterparties, as well as the ability of each party to fulfill its obligations under the contracts, is considered in determining the fair value of the derivative contracts. Credit risk has not had a significant effect on the fair value of VF’s derivative contracts. VF does not have any credit risk-related contingent features or collateral requirements with its derivative contracts.
VF Corporation Fiscal 2019 Form 10-K F-11
VF CORPORATION
Notes to Consolidated Financial Statements
March 2019
Revenue Recognition
As discussed in the "Recently Adopted Accounting Standards" section below, the Company adopted the new revenue recognition standard at the beginning of Fiscal 2019. Accordingly, revenue is recognized when performance obligations under the terms of a contract with the customer are satisfied based on the transfer of control of promised goods or services. The transfer of control typically occurs at a point in time based on consideration of when the customer has (i) an obligation to pay for, (ii) physical possession of, (iii) legal title to, (iv) risks and rewards of ownership of, and (v) accepted the goods or services. The timing of revenue recognition within the wholesale channel occurs either on shipment or delivery of goods based on contractual terms with the customer. The timing of revenue recognition in the direct-to-consumer channel generally occurs at the point of sale within VF-operated or concession retail stores and either on shipment or delivery of goods for e-commerce transactions based on contractual terms with the customer. For finished products shipped directly to customers from our suppliers, the Company's promise to the customer is a performance obligation to provide the specified goods, and thus the Company is the principal in the arrangement and revenue is recognized on a gross basis at the transaction price. For sourcing arrangements, the Company's promise to the customer is to arrange for certain goods, typically finished products, to be provided and thus the Company is acting as an agent and revenue is recognized on a net basis at the fee amount earned.
The duration of contractual arrangements with our customers in the wholesale and direct-to-consumer channels is typically less than one year. Payment terms with wholesale customers are generally between 30 and 60 days while direct-to-consumer arrangements have shorter terms. The Company does not adjust the promised amount of consideration for the effects of a significant financing component as it is expected, at contract inception, that the period between the transfer of the promised good or service to the customer and the customer payment for the good or service will be one year or less.
The amount of revenue recognized in both wholesale and direct-to-consumer channels reflects the expected consideration to be received for providing the goods or services to the customer, which includes estimates for variable consideration. Variable consideration includes allowances for trade terms, sales incentive programs, discounts, markdowns, chargebacks and product returns. Estimates of variable consideration are determined at contract inception and reassessed at each reporting date, at a minimum, to reflect any changes in facts and circumstances. The Company utilizes the expected value method in determining its estimates of variable consideration, based on evaluations of specific product and customer circumstances, historical and anticipated trends, and current economic conditions.
Certain products sold by the Company include an assurance warranty. Product warranty costs are estimated based on historical and anticipated trends, and are recorded as cost of goods sold at the time revenue is recognized.
Revenue from the sale of gift cards is deferred and recorded as a contract liability until the gift card is redeemed by the customer, factoring in breakage as appropriate.
Various VF brands maintain customer loyalty programs where customers earn rewards from qualifying purchases or activities, which are redeemable for discounts on future purchases or other
rewards. For its customer loyalty programs, the Company estimates the standalone selling price of the loyalty rewards and allocates a portion of the consideration for the sale of products to the loyalty points earned. The deferred amount is recorded as a contract liability, and is recognized as revenue when the points are redeemed or when the likelihood of redemption is remote.
The Company has elected to treat all shipping and handling activities as fulfillment costs and recognize the costs as selling, general and administrative expenses at the time the related revenue is recognized. Shipping and handling costs billed to customers are included in net revenues. Sales taxes and value added taxes collected from customers and remitted directly to governmental authorities are excluded from the transaction price.
The Company has licensing agreements for its symbolic intellectual property, most of which include minimum guaranteed royalties. Royalty income is recognized as earned over the respective license term based on the greater of minimum guarantees or the licensees' sales of licensed products at rates specified in the licensing contracts. Royalty income related to the minimum guarantees is recognized using a measure of progress with variable amounts recognized only when the cumulative earned royalty exceeds the minimum guarantees. As of March 2019, the Company expects to recognize $109.4 million of fixed consideration related to the future minimum guarantees in effect under its licensing agreements and expects such amounts to be recognized over time through December 2024. The variable consideration is not disclosed as a remaining performance obligation as the licensing arrangements qualify for the sales-based royalty exemption.
The Company has applied the practical expedient to recognize incremental costs of obtaining a contract as an expense when incurred if the amortization period of the asset that otherwise would have been recognized is one year or less.
For periods prior to the adoption of the new revenue recognition standard, revenue was recognized when (i) there was a contract or other arrangement of sale, (ii) the sales price was fixed or determinable, (iii) title and the risks of ownership had been transferred to the customer, and (iv) collection of the receivable was reasonably assured. Sales to wholesale customers were recognized when title and the risks and rewards of ownership had passed to the customer, based on the terms of sale. E-commerce sales were generally recognized when the product had been received by the customer. Sales at the Company-operated and concession retail stores were recognized at the time products were purchased by consumers.
Revenue from the sale of gift cards was deferred until the gift card was redeemed by the customer or the Company determined that the likelihood of redemption was remote and that it did not have a legal obligation to remit the value of the unredeemed gift card to any jurisdiction under unclaimed property regulations.
Various VF brands maintained customer loyalty programs where customers earned rewards from qualifying purchases or activities. VF recognized revenue when (i) rewards were redeemed by the customer, (ii) points or certificates expired, or (iii) a breakage factor was applied based on historical redemption patterns.
Net revenues reflected adjustments for estimated allowances for trade terms, sales incentive programs, discounts, markdowns,
F-12 VF Corporation Fiscal 2019 Form 10-K
VF CORPORATION
Notes to Consolidated Financial Statements
March 2019
chargebacks and returns. These allowances were estimated based on evaluations of specific product and customer circumstances, historical and anticipated trends and current economic conditions.
Shipping and handling costs billed to customers were included in net revenues. Sales taxes and value added taxes collected from customers and remitted directly to governmental authorities were excluded from net revenues.
Royalty income was recognized as earned based on the greater of the licensees’ sale of licensed products at rates specified in the licensing contracts or contractual minimum royalty levels.
Cost of Goods Sold
Cost of goods sold for VF-manufactured goods includes all materials, labor and overhead costs incurred in the production process. Cost of goods sold for purchased finished goods includes the purchase costs and related overhead. In both cases, overhead includes all costs related to manufacturing or purchasing finished goods, including costs of planning, purchasing, quality control, depreciation, freight, duties, royalties paid to third parties and shrinkage. For product lines with a warranty, a provision for estimated future repair or replacement costs, based on historical and anticipated trends, is recorded when these products are sold.
Selling, General and Administrative Expenses
Selling, general and administrative expenses include costs of product development, selling, marketing and advertising, VF-operated retail stores, concession retail stores, warehousing, distribution, shipping and handling, licensing and administration. Advertising costs are expensed as incurred and totaled $845.7 million in the year ended March 2019, $185.7 million in the three months ended March 2018, $715.9 million in the year ended December 2017 and $637.6 million in the year ended December 2016. Advertising costs include cooperative advertising payments made to VF’s customers as reimbursement for certain costs of advertising VF’s products, which totaled $29.5 million in the year ended March 2019, $7.1 million in the three months ended March 2018, $44.6 million in the year ended December 2017 and $51.8 million in the year ended December 2016. Shipping and handling costs for delivery of products to customers totaled $484.9 million in the year ended March 2019, $96.1 million in the three months ended March 2018, $349.1 million in the year ended December 2017 and $307.3 million in the year ended December 2016. Expenses related to royalty income, including amortization of licensed intangible assets, were $3.6 million in the year ended March 2019, $0.9 million in the three months ended March 2018, $4.2 million in the year ended December 2017 and $4.5 million in the year ended December 2016.
Rent Expense
VF enters into noncancelable operating leases for retail stores, office space, distribution facilities and equipment. Leases for real estate typically have initial terms ranging from 3 to 15 years, generally with renewal options. Leases for equipment typically have initial terms ranging from 2 to 5 years. Most leases have fixed rentals, with many of the real estate leases requiring additional payments for real estate taxes and occupancy-related costs. Contingent rent expense, owed when sales at individual retail store locations exceed a stated base amount, is recognized when the liability is probable. Rent expense for leases having rent holidays, landlord incentives or scheduled rent increases is recorded on a
straight-line basis over the lease term beginning with the earlier of the lease commencement date or the date VF takes possession or control of the leased premises. The amount of the excess straight-line rent expense over scheduled payments is recorded as a deferred liability.
Self-insurance
VF is self-insured for a significant portion of its employee medical, workers’ compensation, vehicle, property and general liability exposures. Liabilities for self-insured exposures are accrued at the present value of amounts expected to be paid based on historical claims experience and actuarial data for forecasted settlements of claims filed and for incurred but not yet reported claims. Accruals for self-insured exposures are included in current and noncurrent liabilities based on the expected periods of payment. Excess liability insurance has been purchased to limit the amount of self-insured risk on claims.
Income Taxes
Income taxes are provided on pre-tax income for financial reporting purposes. Income taxes are based on amounts of taxes payable or refundable in the current year and on expected future tax consequences of events that are recognized in the consolidated financial statements in different periods than they are recognized in tax returns. As a result of timing of recognition and measurement differences between financial accounting standards and income tax laws, temporary differences arise between amounts of pretax financial statement income and taxable income, and between reported amounts of assets and liabilities in the Consolidated Balance Sheets and their respective tax bases. Deferred income tax assets and liabilities reported in the Consolidated Balance Sheets reflect the estimated future tax impact of these temporary differences and net operating loss and net capital loss carryforwards, based on tax rates currently enacted for the years in which the differences are expected to be settled or realized. Realization of deferred tax assets is dependent on future taxable income in specific jurisdictions. Valuation allowances are used to reduce deferred tax assets to amounts considered more likely than not to be realized. Accrued income taxes in the Consolidated Balance Sheets include unrecognized income tax benefits, along with related interest and penalties, appropriately classified as current or noncurrent. All deferred tax assets and liabilities are classified as noncurrent in the Consolidated Balance Sheets. The provision for income taxes also includes estimated interest and penalties related to uncertain tax positions.
Earnings Per Share
Basic earnings per share is computed by dividing net income by the weighted average number of shares of Common Stock outstanding during the period. Diluted earnings per share assumes conversion of potentially dilutive securities such as stock options, restricted stock and restricted stock units.
Concentration of Risks
VF markets products to a broad customer base throughout the world. Products are sold at a range of price points through multiple wholesale and direct-to-consumer channels. VF’s ten largest customers, all U.S.-based retailers, accounted for 19% of Fiscal 2019 total revenues. Sales to VF’s largest customer accounted for 8% of Fiscal 2019 total revenues, the majority of which were derived
VF Corporation Fiscal 2019 Form 10-K F-13
VF CORPORATION
Notes to Consolidated Financial Statements
March 2019
from the Jeans segment. Sales are generally made on an unsecured basis under customary terms that may vary by product, channel of distribution or geographic region. VF continuously monitors the creditworthiness of its customers and has established internal policies regarding customer credit limits. The breadth of product offerings, combined with the large number and geographic diversity of its customers, limits VF’s concentration of risks.
Legal and Other Contingencies
Management periodically assesses liabilities and contingencies in connection with legal proceedings and other claims that may arise from time to time. When it is probable that a loss has been or will be incurred, an estimate of the loss is recorded in the consolidated financial statements. Estimates of losses are adjusted when additional information becomes available or circumstances change. A contingent liability is disclosed when there is at least a reasonable possibility that a material loss may have been incurred. Management believes that the outcome of any outstanding or pending matters, individually and in the aggregate, will not have a material adverse effect on the consolidated financial statements.
Reclassifications
Certain prior year amounts have been reclassified to conform with the Fiscal 2019 presentation, as discussed below in the "Recently Adopted Accounting Standards" section.
Recently Adopted Accounting Standards
In May 2014, the Financial Accounting Standards Board ("FASB") issued Accounting Standards Update ("ASU") No. 2014-09, "Revenue from Contracts with Customers (Topic 606)", a new accounting standard on revenue recognition that outlines a single comprehensive model for entities to use in accounting for revenue arising from contracts with customers. The FASB subsequently issued updates to the standard to provide additional clarification on specific topics. Collectively, the guidance is referred to as FASB
Accounting Standards Codification Topic 606 ("ASC 606"). The standard prescribes a five-step approach to revenue recognition: (1) identify the contracts with the customer; (2) identify the separate performance obligations in the contracts; (3) determine the transaction price; (4) allocate the transaction price to separate performance obligations; and (5) recognize revenue when, or as, each performance obligation is satisfied. The standard also requires additional disclosure regarding the nature, amount, timing and uncertainty of revenues and cash flows arising from contracts with customers. The Company adopted this standard on April 1, 2018, utilizing the modified retrospective method and applying this approach to contracts not completed as of that date. The cumulative effect of initially applying the new standard has been recognized in retained earnings. Comparative prior period information has not been restated and continues to be reported under accounting standards in effect for those periods.
The adoption of ASC 606 resulted in a net increase of $2.0 million in the retained earnings line item of the Consolidated Balance Sheet as of April 1, 2018. The cumulative effect adjustment relates primarily to (i) recognition of revenues for certain wholesale and e-commerce transactions at shipment rather than upon delivery to the customer based on our evaluation of the transfer of control of the goods, (ii) discontinued capitalization of certain costs related to ongoing customer arrangements, and (iii) adjustments to the timing of recognition for certain royalty amounts.
Other effects of the adoption include presentation of allowances for sales incentive programs, discounts, markdowns, chargebacks, and returns as refund liabilities rather than as a reduction to accounts receivable and presentation of the right of return asset within other current assets rather than as a component of inventory in the Consolidated Balance Sheet. Additionally, sourcing fees received from customers and advertising contributions from licensees that had previously been reported as an offset to costs or expenses are now reported as revenue in the Consolidated Statements of Income. Refer to Note 2 for additional revenue disclosures.
F-14 VF Corporation Fiscal 2019 Form 10-K
VF CORPORATION
Notes to Consolidated Financial Statements
March 2019
The following tables compare amounts reported in accordance with the requirements of ASC 606 to the amounts that would have been reported had the new standard not been applied: |
| | | | | | | | | | | | |
Condensed Consolidated Balance Sheet | | | | | | |
| March 2019 | |
(In thousands) | As Reported | | Impact of Adoption | | Balances without Adoption of ASC 606 | |
ASSETS |
| |
| |
| |
Cash and equivalents | $ | 543,011 |
| | $ | — |
| | $ | 543,011 |
| |
Accounts receivable, net | 1,708,796 |
| | (207,941 | ) | | 1,500,855 |
| |
Inventories | 1,943,030 |
| | 58,998 |
| | 2,002,028 |
| |
Other current assets | 478,620 |
| | (55,668 | ) | | 422,952 |
| |
Total current assets | 4,673,457 |
| | (204,611 | ) | | 4,468,846 |
| |
Property, plant and equipment, net | 1,057,268 |
| | — |
| | 1,057,268 |
| |
Goodwill and intangible assets, net | 3,779,161 |
| | — |
| | 3,779,161 |
| |
Other assets | 846,899 |
| | 689 |
| | 847,588 |
| |
TOTAL ASSETS | $ | 10,356,785 |
| | $ | (203,922 | ) | | $ | 10,152,863 |
| |
LIABILITIES AND STOCKHOLDERS' EQUITY | | |
| |
| |
Short-term borrowings and current portion of long-term debt | $ | 670,318 |
| | $ | — |
| | $ | 670,318 |
| |
Accounts payable | 694,733 |
| | 11,605 |
| | 706,338 |
| |
Accrued liabilities | 1,296,553 |
| | (207,191 | ) | | 1,089,362 |
| |
Total current liabilities | 2,661,604 |
| | (195,586 | ) | | 2,466,018 |
| |
Long-term debt | 2,115,884 |
| | — |
| | 2,115,884 |
| |
Other liabilities | 1,280,781 |
| | (1,073 | ) | | 1,279,708 |
| |
Total liabilities | 6,058,269 |
| | (196,659 | ) | | 5,861,610 |
| |
Total stockholders' equity | 4,298,516 |
| | (7,263 | ) | | 4,291,253 |
| |
TOTAL LIABILITIES AND STOCKHOLDERS' EQUITY | $ | 10,356,785 |
| | $ | (203,922 | ) | | $ | 10,152,863 |
| |
|
| | | | | | | | | | | | |
Condensed Consolidated Statements of Income | |
| Year Ended March 2019 | |
(In thousands) | As Reported | | Impact of Adoption | | Balances without Adoption of ASC 606 | |
Net revenues | $ | 13,848,660 |
| | $ | 1,336 |
| | $ | 13,849,996 |
| |
Cost of goods sold | 6,827,481 |
| | (16,056 | ) | | 6,811,425 |
| |
Selling, general and administrative expenses | 5,345,339 |
| | 19,641 |
| | 5,364,980 |
| |
Total costs and operating expenses | 12,172,820 |
| | 3,585 |
| | 12,176,405 |
| |
Operating income | 1,675,840 |
| | (2,249 | ) | | 1,673,591 |
| |
Interest income (expense) and other income (expense), net | (148,436 | ) | | — |
| | (148,436 | ) | |
Income from continuing operations before income taxes | 1,527,404 |
| | (2,249 | ) | | 1,525,155 |
| |
Income taxes | 268,400 |
| | (398 | ) | | 268,002 |
| |
Income from continuing operations | 1,259,004 |
| | (1,851 | ) | | 1,257,153 |
| |
Income (loss) from discontinued operations, net of tax | 788 |
| | (3,456 | ) | | (2,668 | ) | |
Net income | $ | 1,259,792 |
| | $ | (5,307 | ) | | $ | 1,254,485 |
| |
VF Corporation Fiscal 2019 Form 10-K F-15
VF CORPORATION
Notes to Consolidated Financial Statements
March 2019
|
| | | | | | | | | | | | |
Condensed Consolidated Statement of Cash Flows - Operating Activities | |
| Year Ended March 2019 | |
(In thousands) | As Reported | | Impact of Adoption | | Activities without Adoption of ASC 606 | |
OPERATING ACTIVITIES | | |
| |
| |
Net income | $ | 1,259,792 |
| | $ | (5,307 | ) | | $ | 1,254,485 |
| |
Adjustments to reconcile net income to cash provided by operating activities: | | | | | | |
Depreciation and amortization | 301,005 |
| | (162 | ) | | 300,843 |
| |
Other adjustments, net | 59,609 |
| | 3,193 |
| | 62,802 |
| |
Changes in operating assets and liabilities: | | |
|
| |
|
| |
Accounts receivable | (373,012 | ) | | 198,349 |
| | (174,663 | ) | |
Inventories | (135,099 | ) | | (53,427 | ) | | (188,526 | ) | |
Accounts payable | 111,678 |
| | 11,605 |
| | 123,283 |
| |
Income taxes | (19,974 | ) | | (398 | ) | | (20,372 | ) | |
Accrued liabilities | 484,858 |
| | (207,158 | ) | | 277,700 |
| |
Other assets and liabilities | (24,634 | ) | | 53,305 |
| | 28,671 |
| |
Cash provided by operating activities | $ | 1,664,223 |
| | $ | — |
| | $ | 1,664,223 |
| |
There was no impact to investing or financing activities within the Consolidated Statement of Cash Flows as a result of the adoption of ASC 606.
In January 2016, the FASB issued ASU No. 2016-01, "Financial Instruments—Overall (Subtopic 825-10): Recognition and Measurement of Financial Assets and Financial Liabilities", an update to the accounting guidance related to the recognition and measurement of certain financial instruments. This guidance affects the accounting for equity investments, financial liabilities under the fair value option and the presentation and disclosure requirements for financial instruments. This guidance became effective for VF in the first quarter of Fiscal 2019, but did not impact VF's consolidated financial statements. The FASB has subsequently issued an update to clarify the previous guidance. The amendments in this updated guidance became effective for VF in the second quarter of Fiscal 2019, but did not impact VF's consolidated financial statements.
In March 2016, the FASB issued ASU No. 2016-04, "Liabilities—Extinguishments of Liabilities (Subtopic 405-20): Recognition of Breakage for Certain Prepaid Stored-Value Products", an update to the accounting guidance on extinguishments of financial liabilities that exempts prepaid stored-value products, or gift cards, from the existing guidance. The updated guidance requires that financial liabilities related to prepaid stored-value products be subject to breakage accounting, consistent with ASC 606. This guidance became effective for VF in the first quarter of Fiscal 2019, but did not impact VF’s consolidated financial statements.
In August 2016, the FASB issued ASU No. 2016-15, "Statement of Cash Flows (Topic 230): Classification of Certain Cash Receipts and Cash Payments", an update to the accounting guidance that addresses how certain cash receipts and cash payments are presented and classified in the statement of cash flows. This guidance became effective for VF in the first quarter of Fiscal 2019 but did not impact VF’s Consolidated Statements of Cash Flows.
In October 2016, the FASB issued ASU No. 2016-16, "Income Tax (Topic 740): Intra-Entity Transfers of Assets Other Than Inventory", an update to their accounting guidance on the recognition of current and deferred income taxes for intra-entity asset transfers. The new guidance requires an entity to recognize the income tax
consequences of an intra-entity transfer of an asset other than inventory when the transfer occurs. The Company early adopted this guidance in the first quarter of 2017 using the modified retrospective method, which resulted in a cumulative adjustment to retained earnings as of the beginning of the period of adoption. The cumulative adjustment to the January 1, 2017 Consolidated Balance Sheet was a reduction in both the other assets and retained earnings line items of $237.8 million. During the three months ended March 2018, the Company identified an error in the amounts originally recorded when adopting ASU 2016-16 due to the use of an inaccurate tax rate when establishing the deferred tax asset in a certain jurisdiction. The Company recorded the out-of-period correction of $15.5 million to other assets in the Consolidated Balance Sheets and retained earnings in the Consolidated Statements of Stockholders' Equity. The adjustment had no impact on the Consolidated Statements of Income and did not have a material impact on the Consolidated Balance Sheets or Consolidated Statements of Stockholders’ Equity for any period presented.
In January 2017, the FASB issued ASU No. 2017-01, "Business Combinations (Topic 805): Clarifying the Definition of a Business", an update that provides a more narrow framework to be used in evaluating whether a set of assets and activities constitutes a business. This guidance became effective for VF in the first quarter of Fiscal 2019 and was applied when accounting for the acquisitions completed subsequent to the adoption date, but did not impact our conclusions on whether they were a business. Refer to Note 3 for further information related to acquisitions.
In March 2017, the FASB issued ASU No. 2017-07, "Compensation—Retirement Benefits (Topic 715): Improving the Presentation of Net Periodic Pension Cost and Net Periodic Postretirement Benefit Cost", an update which requires employers to disaggregate the service cost component from other components of net periodic benefit costs. The standard requires employers to report the service cost component in the same line item as other compensation costs and to report the other components of net periodic benefit costs (which include interest cost, expected return on plan assets, amortization
F-16 VF Corporation Fiscal 2019 Form 10-K
VF CORPORATION
Notes to Consolidated Financial Statements
March 2019
of prior service costs or credits and deferred actuarial gains and losses) separately and outside of operating income. The update specifies that only the service cost component is eligible for capitalization, which is consistent with VF’s current practice. The presentation change in the Consolidated Statements of Income requires application on a retrospective basis. The ASU was adopted by the Company on April 1, 2018, and as a result, operating income decreased and other income (expense), net increased by $1.3 million for the three months ended March 2018 and operating income increased and other income (expense), net decreased by $9.9 million and $87.2 million in the the years ended December 2017 and December 2016, respectively. VF applied the practical expedient permitted under the guidance which allows entities to use information previously disclosed in the pension and other post-retirement benefit plans footnote as the basis to apply the retrospective presentation requirements. Refer to pension disclosure in Note 15.
In May 2017, the FASB issued ASU No. 2017-09, "Compensation—Stock Compensation (Topic 718): Scope of Modification Accounting", an update that amends the scope of modification accounting for share-based payment arrangements. This update provides guidance on the types of changes to the terms or conditions of share-based payment awards to which an entity would be required to apply modification accounting. This guidance became effective for VF beginning in the first quarter of Fiscal 2019, but did not impact VF’s consolidated financial statements.
In January 2018, the FASB released guidance on the accounting for tax on the global intangible low-taxed income ("GILTI") provisions of the Tax Cuts and Jobs Act ("Tax Act"). The GILTI provisions impose a tax on foreign income in excess of a deemed return on tangible assets of foreign corporations. The guidance indicates that companies must make a policy decision to either record deferred taxes related to GILTI inclusions or treat any taxes on GILTI inclusions as period costs. The Company has completed its analysis related to this accounting policy election and has determined it will treat the taxes resulting from GILTI as a current-period expense, which is consistent with the treatment prior to the accounting policy election.
In March 2018, the FASB issued ASU No. 2018-05, "Income Taxes (Topic 740): Amendments to SEC Paragraphs Pursuant to SEC Staff Accounting Bulletin No. 118", which allowed the Company to record provisional amounts in earnings for the year ended December 30, 2017 due to the complexities involved in accounting for the enactment of the Tax Act. The Company recognized the estimated income tax effects of the Tax Act in its 2017 consolidated financial statements in accordance with Securities and Exchange Commission ("SEC") Staff Accounting Bulletin No. 118 ("SAB 118") and recorded revisions of our provisional estimate during the three months ended March 2018 and during the year ended March 2019. VF finalized its accounting for the impact of the Tax Act during the three months ended December 2018. Refer to Note 18 for more information regarding the amounts recorded.
Recently Issued Accounting Standards
In February 2016, the FASB issued ASU No. 2016-02, “Leases (Topic 842)”, a new accounting standard on leasing. The FASB has subsequently issued updates to the standard to provide additional clarification on specific topics, including permitted transition methods. This new standard will require companies to record most leased assets and liabilities on the balance sheets, and also retains
a dual model approach for assessing lease classification and recognizing expense. The new standard provides a number of optional practical expedients for transition. The Company will elect the package of practical expedients that must be taken together that allows entities to (i) not reassess whether existing contracts contain leases, (ii) carryforward the existing lease classification, and (iii) not reassess initial direct costs associated with existing leases. The Company will also elect the land easement expedient that allows entities to not evaluate land easements under the new standard at adoption if they were not previously accounted for as leases, and the expedient that allows entities to not separate lease and non-lease components for specified asset classes. Further, the Company will elect a short-term lease exception policy that permits not applying the recognition requirements of the standard to leases with terms of 12 months or less. A cross functional implementation team has completed its impact analysis and expects the standard to have a material impact on the Consolidated Balance Sheets related to the recognition of right-of-use assets and lease liabilities primarily for the Company’s operating leases for real estate space. Refer to Note 20 for disclosure of future minimum lease payments under these arrangements as of March 2019. The Company does not expect the standard to have a material impact on the Consolidated Statements of Income. The Company will adopt the new standard as of the beginning of the year ending March 28, 2020 (“Fiscal 2020”) utilizing the modified retrospective method and will recognize in equity the immaterial cumulative effect of initially applying the new standard. The effective date of the standard will be used as the date of initial application and comparative prior period financial information will not be restated.
In June 2016, the FASB issued ASU No. 2016-13, "Financial Instruments—Credit Losses (Topic 326): Measurement of Credit Losses on Financial Instruments", which requires entities to use a forward-looking approach based on expected losses to estimate credit losses on certain types of financial instruments, including trade receivables. The FASB has subsequently issued updates to the standard to provide additional clarification on specific topics. This guidance will be effective for VF in the first quarter of the year ended April 3, 2021 ("Fiscal 2021") with early adoption permitted. The Company is evaluating the impact that adopting this guidance will have on VF’s consolidated financial statements.
In August 2017, the FASB issued ASU No. 2017-12, "Derivatives and Hedging (Topic 815): Targeted Improvements to Accounting for Hedging Activities", an update that amends and simplifies certain aspects of hedge accounting rules to better portray the economic results of risk management activities in the financial statements. The FASB has subsequently issued updates to the standard to provide additional guidance on specific topics. This guidance will be effective for VF in the first quarter of Fiscal 2020. The Company does not expect the adoption of this guidance to have a material impact on VF's consolidated financial statements.
In February 2018, the FASB issued ASU No. 2018-02, "Income Statement-Reporting Comprehensive Income (Topic 220): Reclassification of Certain Tax Effects from Accumulated Other Comprehensive Income", an update that addresses the effect of the change in the U.S. federal corporate income tax rate due to the enactment of the Tax Act on items within accumulated other comprehensive income (loss). The guidance will be effective for VF in the first quarter of Fiscal 2020 with early adoption permitted. The Company will elect to reclassify the income tax effects of the Tax Act on items within accumulated other comprehensive income (loss) of $61.9 million to retained earnings and provide related
VF Corporation Fiscal 2019 Form 10-K F-17
VF CORPORATION
Notes to Consolidated Financial Statements
March 2019
disclosures when the guidance is adopted during the first quarter of Fiscal 2020.
In June 2018, the FASB issued ASU No. 2018-07, "Compensation—Stock Compensation (Topic 718): Improvements to Nonemployee Share-Based Payment Accounting", an update that expands the scope of Topic 718 to include share-based payment transactions for acquiring goods and services from nonemployees. The guidance will be effective for VF in the first quarter of Fiscal 2020. The Company does not expect the adoption of this guidance to have a material impact on VF's consolidated financial statements.
In July 2018, the FASB issued ASU No. 2018-09, "Codification Improvements", an update that provides technical corrections, clarifications and other improvements across a variety of accounting topics. The transition and effective date guidance is based on the facts and circumstances of each update; however, many of them will be effective for VF in the first quarter of Fiscal 2020. The Company does not expect the adoption of this guidance to have a material impact on VF's consolidated financial statements.
In August 2018, the FASB issued ASU No. 2018-13, "Fair Value Measurement (Topic 820): Disclosure Framework—Changes to the Disclosure Requirements for Fair Value Measurement", an update that modifies the disclosure requirements for fair value measurements by removing, modifying or adding certain
disclosures. The guidance will be effective for VF in the first quarter of Fiscal 2021 with early adoption permitted. The Company is evaluating the impact that adopting this guidance will have on VF's disclosures.
In August 2018, the FASB issued ASU No. 2018-14, "Compensation— Retirement Benefits—Defined Benefit Plans—General (Subtopic 715-20): Disclosure Framework—Changes to the Disclosure Requirements for Defined Benefit Plans", an update that modifies the disclosure requirements for employers who sponsor defined benefit pension or other postretirement plans. The guidance will be effective for VF in the first quarter of Fiscal 2021 with early adoption permitted. The Company is evaluating the impact that adopting this guidance will have on VF's disclosures.
In August 2018, the FASB issued ASU No. 2018-15, "Intangibles—Goodwill and Other—Internal-Use Software (Subtopic 350-40): Customer’s Accounting for Implementation Costs Incurred in a Cloud Computing Arrangement That Is a Service Contract", an update that aligns the requirements for capitalizing implementation costs incurred in a hosting arrangement that is a service contract with the requirements for capitalizing implementation costs incurred to develop or obtain internal-use software. The guidance will be effective for VF in the first quarter of Fiscal 2021 with early adoption permitted. The Company is evaluating the impact that adopting this guidance will have on VF's consolidated financial statements.
NOTE 2 — REVENUES
Performance Obligations
Disclosure is required for the aggregate transaction price allocated to performance obligations that are unsatisfied at the end of a reporting period, unless the optional practical expedients are applicable. VF has elected the practical expedients to not disclose the transaction price allocated to remaining performance obligations for (i) variable consideration related to sales-based royalty arrangements, and (ii) contracts with an original expected duration of one year or less.
As of March 2019, there are no arrangements with transaction price allocated to remaining performance obligations other than contracts for which the Company has applied the practical expedients and fixed consideration related to future minimum guarantees discussed in Note 1.
For the year ended March 2019, revenue recognized from performance obligations satisfied, or partially satisfied, in prior periods was not material.
Contract Balances
Accounts receivable represent the Company's unconditional right to receive consideration from a customer and are recorded at net
invoiced amounts, less an estimated allowance for doubtful accounts.
Contract assets are rights to consideration in exchange for goods or services that have been transferred to a customer when that right is conditional on something other than the passage of time. Once the Company has an unconditional right to consideration under a contract, amounts are invoiced and contract assets are reclassified to accounts receivable. The Company's primary contract assets relate to sales-based royalty arrangements, which are discussed in more detail within Note 1.
Contract liabilities are recorded when a customer pays consideration, or the Company has a right to an amount of consideration that is unconditional, before the transfer of a good or service to the customer and thus represent the Company's obligation to transfer the good or service to the customer at a future date. The Company's primary contract liabilities relate to gift cards, loyalty programs and sales-based royalty arrangements, which are discussed in more detail within Note 1.
F-18 VF Corporation Fiscal 2019 Form 10-K
VF CORPORATION
Notes to Consolidated Financial Statements
March 2019
The following table provides information about accounts receivable, contract assets and contract liabilities:
|
| | | | | | | | | |
(In thousands) | | March 2019 | | | At Adoption - April 1, 2018 (a) |
Accounts receivable, net | | $ | 1,708,796 |
| | | $ | 1,408,587 |
|
Contract assets (b) | | 4,499 |
| | | 2,600 |
|
Contract liabilities (c) | | 32,175 |
| | | 28,252 |
|
| |
(a) | The Company adopted ASC 606 on April 1, 2018. Refer to Note 1 for additional information. |
| |
(b) | Included in the other current assets line item in the Consolidated Balance Sheets. |
| |
(c) | Included in the accrued liabilities and other liabilities line items in the Consolidated Balance Sheets. |
For the year ended March 2019, the Company recognized $65.3 million of revenue that was included in the contract liability balance during the year. The change in the contract asset and contract liability balances primarily results from the timing differences between the Company's satisfaction of performance obligations and the customer's payment.
Disaggregation of Revenue
The following table shows disaggregation of our revenues by channel and geography, which provides a meaningful depiction of how the nature, timing and uncertainty of revenues are affected by economic factors. The wholesale channel includes fees generated from sourcing activities as the customers and point-in-time revenue recognition are similar to other wholesale arrangements. As discussed in Note 1, we adopted the guidance in ASC 606 effective April 1, 2018 using the modified retrospective method of adoption. As a result, revenue reported for the three months ended March 2018 and years ended December 2017 and 2016 have not been presented.
|
| | | | | | | | | | | | | | | | | | | | | | | | |
| Year ended March 2019 | |
(In thousands) | Outdoor | | Active | | Work | | Jeans | | Other | | Total | |
Channel revenues |
| |
| |
| |
| |
| |
| |
Wholesale | $ | 2,865,630 |
| | $ | 2,460,692 |
| | $ | 1,678,473 |
| | $ | 2,169,088 |
| | $ | 22,343 |
| | $ | 9,196,226 |
| |
Direct-to-consumer | 1,770,580 |
| | 2,234,053 |
| | 160,970 |
| | 289,196 |
| | 101,715 |
| | 4,556,514 |
| |
Royalty | 12,814 |
| | 27,047 |
| | 22,574 |
| | 33,485 |
| | — |
| | 95,920 |
| |
Total | $ | 4,649,024 |
| | $ | 4,721,792 |
| | $ | 1,862,017 |
| | $ | 2,491,769 |
| | $ | 124,058 |
| | $ | 13,848,660 |
| |
| | | | | | | | | | | | |
Geographic revenues | | | | | | | | | | | | |
United States | $ | 2,246,706 |
| | $ | 2,499,393 |
| | $ | 1,492,548 |
| | $ | 1,763,575 |
| | $ | 124,058 |
| | $ | 8,126,280 |
| |
International | 2,402,318 |
| | 2,222,399 |
| | 369,469 |
| | 728,194 |
| | — |
| | 5,722,380 |
| |
Total | $ | 4,649,024 |
| | $ | 4,721,792 |
| | $ | 1,862,017 |
| | $ | 2,491,769 |
| | $ | 124,058 |
| | $ | 13,848,660 |
| |
VF Corporation Fiscal 2019 Form 10-K F-19
VF CORPORATION
Notes to Consolidated Financial Statements
March 2019
NOTE 3 — ACQUISITIONS
On October 2, 2017, VF acquired 100% of the outstanding shares of Williamson-Dickie Mfg. Co. (“Williamson-Dickie”) for $800.7 million in cash, subject to working capital and other adjustments. The purchase price was primarily funded with short-term borrowings. During the three months ended March 2018, the purchase consideration was reduced by $2.3 million associated with the final working capital adjustment, resulting in a revised purchase price of $798.4 million. No additional adjustments have been made since that date, and the purchase price allocation was finalized during the three months ended September 2018.
Williamson-Dickie was a privately held company based in Ft. Worth, Texas, and was one of the largest companies in the workwear sector with a portfolio of brands including Dickies®, Workrite®, Kodiak®, Terra® and Walls®. The acquisition of Williamson-Dickie brings together complementary assets and capabilities, and creates a
workwear business that will now serve an even broader set of consumers and industries around the world.
For the six months ended September 2018, Williamson-Dickie contributed revenues of $471.9 million and net income of $33.3 million, including restructuring charges. Given the ongoing integration and change in operating nature of the acquired business, it is impracticable to determine the revenues or operating results contributed subsequent to September 2018. Williamson-Dickie contributed revenues of $233.1 million and net income of $4.9 million to VF in the three months ended March 2018, including restructuring charges. For the period from October 2, 2017 through December 30, 2017, Williamson-Dickie contributed revenues of $247.2 million and net income of $9.6 million to VF, including restructuring charges.
The following table summarizes the estimated fair values of the Williamson-Dickie assets acquired and liabilities assumed at the date of acquisition:
|
| | | | |
(In thousands) | | October 2, 2017 |
Cash and equivalents | | $ | 60,172 |
|
Accounts receivable | | 146,403 |
|
Inventories | | 251,778 |
|
Other current assets | | 8,447 |
|
Property, plant and equipment | | 105,119 |
|
Intangible assets | | 397,755 |
|
Other assets | | 9,665 |
|
Total assets acquired | | 979,339 |
|
| | |
Short-term borrowings | | 17,565 |
|
Accounts payable | | 88,052 |
|
Other current liabilities | | 109,964 |
|
Deferred income tax liabilities | | 15,160 |
|
Other noncurrent liabilities | | 33,066 |
|
Total liabilities assumed | | 263,807 |
|
| | |
Net assets acquired | | 715,532 |
|
Goodwill | | 82,863 |
|
Purchase price | | $ | 798,395 |
|
The goodwill is attributable to the acquired workforce of Williamson-Dickie and the significant synergies expected to arise as a result of the acquisition. All of the goodwill was assigned to the Work segment and $52.3 million is expected to be deductible for tax purposes.
The Dickies®, Kodiak®, Terra® and Walls® trademarks, which management believes to have indefinite lives, have been valued at $316.1 million. The Workrite® trademark, valued at $0.8 million, is being amortized over three years.
Amortizable intangible assets have been assigned values of $78.6 million for customer relationships and $2.3 million for distribution agreements. Customer relationships are being amortized using an accelerated method over periods ranging from 10-13 years. Distribution agreements are being amortized on a straight-line basis over four years.
Total transaction expenses for the Williamson-Dickie acquisition were $15.0 million, all of which were recognized in the year ended December 2017 in the selling, general and administrative expenses line item in the Consolidated Statements of Income.
F-20 VF Corporation Fiscal 2019 Form 10-K
VF CORPORATION
Notes to Consolidated Financial Statements
March 2019
The following unaudited pro forma summary presents consolidated information of VF as if the acquisition of Williamson-Dickie had occurred on January 3, 2016:
|
| | | | | | | | |
(In thousands, except per share amounts) | | Year Ended December 2017 (unaudited) | | Year Ended December 2016 (unaudited) |
Total revenues | | $ | 12,475,116 |
| | $ | 11,888,704 |
|
Income from continuing operations | | 763,563 |
| | 1,097,572 |
|
Earnings per common share from continuing operations | | | | |
Basic | | $ | 1.91 |
| | $ | 2.64 |
|
Diluted | | 1.89 |
| | 2.60 |
|
These pro forma amounts have been calculated after applying VF’s accounting policies and adjusting the results of Williamson-Dickie to reflect the additional depreciation and amortization that would have been charged assuming the fair value adjustments to property, plant, and equipment, and intangible assets had been applied from January 3, 2016, with related tax effects.
The pro forma financial information in the years ended December 2017 and 2016 exclude $41.6 million and $4.1 million, respectively, of expense related to Williamson-Dickie’s executive compensation plans, which were terminated concurrent with the merger. The pro forma financial information in the year ended December 2016 includes $12.2 million of VF’s transaction expenses related to the acquisition.
Pro forma financial information is not necessarily indicative of VF’s operating results if the acquisition had been effected at the date indicated, nor is it necessarily indicative of future operating results. Amounts do not include any marketing leverage, operating efficiencies or cost savings that VF believes are achievable.
Icebreaker
On April 3, 2018, VF acquired 100% of the stock of Icebreaker Holdings Limited ("Icebreaker") for NZ$274.4 million ($198.5
million) in cash, subject to working capital and other adjustments. The purchase price was primarily funded with short-term borrowings. The purchase price increased NZ$0.9 million ($0.7 million) during the three months ended March 2019 and decreased NZ$ 1.4 million ($0.9 million) for the year ended March 2019, related to working capital adjustments, resulting in a revised purchase price of NZ$273.0 million ($197.6 million). The purchase price allocation was finalized during the three months ended March 2019.
Icebreaker was a privately held company based in Auckland, New Zealand. Icebreaker®, the primary brand, specializes in high-performance apparel based on natural fibers, including Merino wool, plant-based fibers and recycled fibers. It is an ideal complement to VF's Smartwool® brand, which also features Merino wool in its clothing and accessories. Together, the Smartwool® and Icebreaker® brands will position VF as a global leader in the Merino wool and natural fiber categories.
For the year ended March 2019, Icebreaker contributed revenues of $174.2 million, representing 1.3% of VF's total revenue for the period. Icebreaker contributed net income of $14.6 million during the year ended March 2019, representing 1.2% of VF's net income in the period.
VF Corporation Fiscal 2019 Form 10-K F-21
VF CORPORATION
Notes to Consolidated Financial Statements
March 2019
The following table summarizes the estimated fair values of the Icebreaker assets acquired and liabilities assumed at the date of acquisition:
|
| | | | | |
(In thousands) | | April 3, 2018 | |
Cash and equivalents | | $ | 6,444 |
| |
Accounts receivable | | 16,781 |
| |
Inventories | | 31,728 |
| |
Other current assets | | 3,931 |
| |
Property, plant and equipment | | 3,858 |
| |
Intangible assets | | 98,041 |
| |
Other assets | | 4,758 |
| |
Total assets acquired | | 165,541 |
| |
| | | |
Short-term borrowings | | 7,235 |
| |
Accounts payable | | 2,075 |
| |
Other current liabilities | | 21,262 |
| |
Deferred income tax liabilities | | 26,870 |
| |
Other noncurrent liabilities | | 433 |
| |
Total liabilities assumed | | 57,875 |
| |
| | | |
Net assets acquired | | 107,666 |
| |
Goodwill | | 89,943 |
| |
Purchase price | | $ | 197,609 |
| |
The goodwill is attributable to the acquired workforce of Icebreaker and the significant synergies expected to arise as a result of the acquisition. All of the goodwill has been assigned to the Outdoor segment and none is expected to be deductible for tax purposes.
The Icebreaker® trademark, which management determined to have an indefinite life, has been valued at $70.1 million. Amortizable intangible assets have been assigned values of $27.8 million for customer relationships and $0.2 million for distribution agreements. Customer relationships are being amortized using an accelerated method over 11.5 years. Distribution agreements are being amortized on a straight-line basis over four years.
Total transaction expenses for the Icebreaker acquisition of $7.4 million have been recognized in the selling, general and administrative expenses line item in the Consolidated Statements of Income, of which $4.1 million, $1.4 million, and $1.9 million was recognized during the year ended March 2019, the three months ended March 2018, and the year ended December 2017, respectively. In addition, the Company recognized a $9.9 million gain on derivatives used to hedge the purchase price of Icebreaker in the other income (expense), net line item in the Consolidated Statements of Income, of which $0.3 million, $4.3 million, and $5.3 million was recognized during the year ended March 2019, the three months ended March 2018, and the year ended December 2017, respectively.
Pro forma results of operations of the Company would not be materially different as a result of the Icebreaker acquisition and therefore are not presented.
Altra
On June 1, 2018, VF acquired 100% of the stock of Icon-Altra LLC, plus certain assets in Europe ("Altra"). The purchase price was $131.7 million in cash, subject to working capital and other adjustments and was primarily funded with short-term borrowings. The purchase price decreased $0.1 million during the year ended March 2019, related to working capital adjustments, resulting in a revised purchase price of $131.6 million. The allocation of the purchase price was finalized during the three months ended December 2018, resulting in a decrease of goodwill by $1.5 million related to a final adjustment to working capital balances.
Altra®, the primary brand, is an athletic and performance-based lifestyle footwear brand, based in Logan, Utah. Altra provides VF with a unique and differentiated technical footwear brand and a capability that, when applied across VF's footwear platforms, will serve as a catalyst for growth.
Altra contributed revenues of $50.2 million and net income of $0.8 million during the year ended March 2019.
F-22 VF Corporation Fiscal 2019 Form 10-K
VF CORPORATION
Notes to Consolidated Financial Statements
March 2019
The following table summarizes the estimated fair values of the Altra assets acquired and liabilities assumed at the date of acquisition:
|
| | | | | |
(In thousands) | | June 1, 2018 | |
Accounts receivable | | $ | 11,629 |
| |
Inventories | | 9,310 |
| |
Other current assets | | 575 |
| |
Property, plant and equipment | | 1,107 |
| |
Intangible assets | | 59,700 |
| |
Total assets acquired | | 82,321 |
| |
| |
| |
Accounts payable | | 5,068 |
| |
Other current liabilities | | 7,415 |
| |
Total liabilities assumed | | 12,483 |
| |
| |
| |
Net assets acquired | | 69,838 |
| |
Goodwill | | 61,719 |
| |
Purchase price | | $ | 131,557 |
| |
The goodwill is attributable to the significant growth and synergies expected to arise as a result of the acquisition. All of the goodwill was assigned to the Outdoor segment and is expected to be deductible for tax purposes.
The Altra® trademark, which management determined to have an indefinite life, has been valued at $46.4 million. Amortizable intangible assets have been assigned values of $13.0 million for customer relationships and $0.3 million for distribution agreements. Customer relationships are being amortized using an accelerated method over 15 years. Distribution agreements are being amortized on a straight-line basis over four years.
Total transaction expenses for the Altra acquisition were $2.3 million, all of which were recognized in the selling, general and administrative expenses line item in the Consolidated Statements of Income during the year ended March 2019.
Pro forma results of operations of the Company would not be materially different as a result of the Altra acquisition and therefore are not presented.
NOTE 4 — DISCONTINUED OPERATIONS AND OTHER DIVESTITURES
The Company continuously assesses the composition of its portfolio to ensure it is aligned with its strategic objectives and positioned to maximize growth and return to shareholders.
Nautica® Brand Business
During the three months ended December 2017, the Company reached the strategic decision to exit the Nautica® brand business, and determined that it met the held-for-sale and discontinued operations accounting criteria. Accordingly, the Company has reported the results of the Nautica® brand business as discontinued operations in the Consolidated Statements of Income and presented the related held-for-sale assets and liabilities as assets and liabilities of discontinued operations in the Consolidated Balance Sheets through the date of sale.
On April 30, 2018, VF completed the sale of the Nautica® brand business. The Company received proceeds of $285.8 million, net of cash sold, resulting in a final after-tax loss on sale of $38.2 million, which includes a decrease of $5.4 million and an increase of $18.1 million in the estimated loss on sale included in the income (loss) from discontinued operations, net of tax line item in the Consolidated Statements of Income for the year ended March 2019
and the three months ended March 2018, respectively. The year ended December 2017 includes a $25.5 million estimated loss on sale.
The results of the Nautica® brand's North America business were previously reported in the former Sportswear segment, and the results of the Asia business were previously reported in the former Outdoor & Action Sports segment. The results of the Nautica® brand business recorded in the income (loss) from discontinued operations, net of tax line item in the Consolidated Statements of Income were income of $0.8 million (including a $5.4 million decrease in the estimated loss on sale), losses of $8.4 million (including an $18.1 million increase in the estimated loss on sale), losses of $95.2 million (including an estimated loss on sale of $25.5 million and an impairment charge of $104.7 million) and income of $31.4 million for the year ended March 2019, the three months ended March 2018 and the years ended December 2017 and 2016, respectively.
VF Corporation Fiscal 2019 Form 10-K F-23
VF CORPORATION
Notes to Consolidated Financial Statements
March 2019
Certain corporate overhead costs and segment costs previously allocated to the Nautica® brand business for segment reporting purposes did not qualify for classification within discontinued operations and have been reallocated to continuing operations. In addition, the goodwill impairment charge recorded in the three months ended September 30, 2017 of $104.7 million related to the Nautica® reporting unit, previously excluded from the calculation of segment profit, was reclassified to discontinued operations.
Under the terms of the transition services agreement, the Company is providing certain support services for periods up to 12 months from the closing date of the transaction. Revenue and related expense items associated with the transition services are recorded in the Other category, and operating expense reimbursements are recorded within the corporate and other expenses line item, in the reconciliation of segment revenues and segment profit in Note 19.
Licensing Business
During the three months ended April 1, 2017, the Company reached the strategic decision to exit its Licensing Business, which comprised the Licensed Sports Group (“LSG”) and the JanSport® brand collegiate businesses. Accordingly, the Company has reported the results of the businesses as discontinued operations in the Consolidated Statements of Income through their respective dates of sale.
LSG included the Majestic® brand and was previously reported within the former Imagewear segment. On April 28, 2017, VF completed the sale of the LSG business. The Company received proceeds of $213.5 million, net of cash sold, resulting in a final after-tax loss on sale of $4.1 million, which is included in the income (loss) from discontinued operations, net of tax line item in the Consolidated Statement of Income for the year ended December 2017.
The LSG results recorded in the income (loss) from discontinued operations, net of tax line item in the Consolidated Statements of Income were losses of $4.6 million (including the loss on sale of $4.1 million) and income of $63.3 million for the years ended December 2017 and 2016, respectively.
During the three months ended December 2017, VF completed the sale of the assets associated with the JanSport® brand collegiate business, which was previously included within the former Outdoor & Action Sports segment. The Company received net proceeds of $1.5 million and recorded a final after-tax loss on sale of $0.2 million, which is included in the income (loss) from discontinued operations, net of tax line item in the Consolidated Statement of Income for the year ended December 2017.
The JanSport® brand collegiate results recorded in the income (loss) from discontinued operations, net of tax line item in the
Consolidated Statements of Income were losses of $6.5 million (including the loss on sale of $0.2 million) and $1.0 million for the years ended December 2017 and 2016, respectively.
Certain corporate overhead and other costs previously allocated to the Licensing Business for segment reporting purposes did not qualify for classification within discontinued operations and have been reallocated to continuing operations.
Under the terms of the transition services agreement, the Company is providing certain support services for periods up to 24 months from the closing date of the transaction. Revenue and related expense items associated with the transition services are recorded in the Work segment, and operating expense reimbursements are recorded within the corporate and other expenses line item in the reconciliation of segment revenues and segment profit in Note 19.
Former Contemporary Brands Segment
During the three months ended July 2, 2016, the Company reached the strategic decision to sell the businesses in its former Contemporary Brands segment. Accordingly, the Company has reported the results of the former Contemporary Brands segment as discontinued operations in the Consolidated Statements of Income through the date of sale.
On August 26, 2016, VF completed the sale of its former Contemporary Brands segment and received proceeds of $116.0 million, net of cash sold. The former Contemporary Brands segment included the businesses of the 7 For All Mankind®, Splendid® and Ella Moss® brands and was previously disclosed as a separate reportable segment of VF. The transaction resulted in an after-tax loss on sale of $104.4 million which was included in the income (loss) from discontinued operations, net of tax line item in the Consolidated Statement of Income for the year ended December 2016.
The results of the former Contemporary Brands segment recorded in the income (loss) from discontinued operations, net of tax line item in the Consolidated Statement of Income were losses of $98.4 million (including the loss on sale of $104.4 million) for the year ended December 2016.
Certain corporate overhead costs previously allocated to the former Contemporary Brands segment for segment reporting purposes did not qualify for classification within discontinued operations and have been reallocated to continuing operations.
VF provided certain support services under transition services agreements and completed these services during the three months ended September 30, 2017. These services did not have a material impact on VF’s Consolidated Statement of Income for the year ended December 2017.
F-24 VF Corporation Fiscal 2019 Form 10-K
VF CORPORATION
Notes to Consolidated Financial Statements
March 2019
Summarized Discontinued Operations Financial Information
The following table summarizes the major line items included for the Nautica® brand business, the Licensing Business and the former Contemporary Brands segment that are included in the income (loss) from discontinued operations, net of tax line item in the Consolidated Statements of Income:
|
| | | | | | | | | | | | | | | | | |
| | Year Ended March | | | Three Months Ended March (Transition Period) | | Year Ended December |
(In thousands) | | 2019 | | | 2018 | | 2017 | | 2016 |
Net revenues | | $ | 21,913 |
| | | $ | 94,362 |
| | $ | 588,383 |
| | $ | 1,180,677 |
|
Cost of goods sold | | 14,706 |
| | | 48,946 |
| | 349,382 |
| | 691,715 |
|
Selling, general and administrative expenses | | 12,391 |
| | | 34,649 |
| | 191,898 |
| | 354,773 |
|
Impairment of goodwill | | — |
| | | — |
| | 104,651 |
| | — |
|
Interest expense, net | | — |
| | | — |
| | (27 | ) | | (199 | ) |
Other income, net | | 272 |
| | | — |
| | 6 |
| | 2 |
|
(Loss) income from discontinued operations before income taxes | | (4,912 | ) | | | 10,767 |
| | (57,569 | ) | | 133,992 |
|
Gain (loss) on the sale of discontinued operations before income taxes | | 4,589 |
| | | (18,065 | ) | | (34,019 | ) | | (154,275 | ) |
Total loss from discontinued operations before income taxes | | (323 | ) | | | (7,298 | ) | | (91,588 | ) | | (20,283 | ) |
Income tax benefit (expense) (a) | | 1,111 |
| | | (1,073 | ) | | (14,698 | ) | | 15,535 |
|
Income (loss) from discontinued operations, net of tax | | $ | 788 |
| | | $ | (8,371 | ) | | $ | (106,286 | ) | | $ | (4,748 | ) |
| |
(a) | Income tax expense for the year ended December 2017 was impacted by $8.6 million of tax expense related to GAAP and tax basis differences for the LSG business. Additionally, the goodwill impairment charge and estimated loss on sale related to the Nautica® brand business for the year ended December 2017 were nondeductible for income tax purposes. |
The following table summarizes the carrying amounts of major classes of assets and liabilities of discontinued operations for each of the periods presented.
|
| | | | | | | | | | | | | |
(In thousands) | | March 2019 | | | March 2018 | | December 2017 |
Cash | | $ | — |
| | | $ | 2,330 |
| | $ | 2,592 |
|
Accounts receivable, net | | — |
| | | 26,298 |
| | 27,941 |
|
Inventories | | — |
| | | 55,610 |
| | 43,297 |
|
Other current assets | | — |
| | | 1,247 |
| | 2,497 |
|
Property, plant and equipment, net | | — |
| | | 15,021 |
| | 14,914 |
|
Intangible assets | | — |
| | | 262,202 |
| | 262,352 |
|
Goodwill | | — |
| | | 49,005 |
| | 49,005 |
|
Other assets | | — |
| | | 3,961 |
| | 3,631 |
|
Allowance to reduce assets to estimated fair value, less costs to sell | | — |
| | | (42,094 | ) | | (25,529 | ) |
Total assets of discontinued operations | | $ | — |
| | | $ | 373,580 |
| | $ | 380,700 |
|
Accounts payable | | $ | — |
| | | $ | 11,619 |
| | $ | 16,993 |
|
Accrued liabilities | | — |
| | | 10,658 |
| | 18,203 |
|
Other liabilities | | — |
| | | 11,912 |
| | 12,011 |
|
Deferred income tax liabilities (a) | | — |
| | | 51,838 |
| | 53,812 |
|
Total liabilities of discontinued operations | | $ | — |
| | | $ | 86,027 |
| | $ | 101,019 |
|
| |
(a) | Deferred income tax balances reflect VF's consolidated netting by jurisdiction. |
VF Corporation Fiscal 2019 Form 10-K F-25
VF CORPORATION
Notes to Consolidated Financial Statements
March 2019
The cash flows related to discontinued operations have not been segregated, and are included in the Consolidated Statements of Cash Flows. The following table summarizes depreciation and amortization, capital expenditures and the significant operating noncash items from discontinued operations for the years ended December 2017 and 2016:
|
| | | | | | | | |
| | Year Ended December |
(In thousands) | | 2017 | | 2016 |
Depreciation and amortization | | $ | 14,023 |
| | $ | 27,360 |
|
Capital expenditures | | 2,592 |
| | 4,795 |
|
Impairment of goodwill | | 104,651 |
| | — |
|
Depreciation and amortization, capital expenditures and operating noncash items related to discontinued operations were not material for year ended March 2019 and the three months ended March 2018.
Reef® Brand Business
During the three months ended September 29, 2018, the Company reached the decision to sell the Reef® brand business, which was included in the Active segment.
VF signed a definitive agreement for the sale of the Reef® brand business on October 2, 2018, and completed the transaction on October 26, 2018. VF received cash proceeds of $139.4 million, and recorded a $14.4 million final loss on sale, which was included in the other income (expense), net line item in the Consolidated Statement of Income for the year ended March 2019.
Under the terms of the transition services agreement, the Company is providing certain support services for periods up to 21 months from the closing date of the transaction. Revenue and related expense items associated with the transition services and operating expense reimbursements are recorded in the Other category in the reconciliation of segment revenues and segment profit in Note 19.
Van Moer Business
During the three months ended September 29, 2018, the Company reached the decision to sell the Van Moer business, acquired with Williamson-Dickie, which was included in the Work segment.
VF completed the sale of the Van Moer business on October 5, 2018, and received cash proceeds of €7.0 million ($8.1 million). VF recorded a $22.4 million final loss on sale, which was included in the other income (expense), net line item in the Consolidated Statement of Income for the year ended March 2019.
Spin-Off of Jeans Business
On August 13, 2018, VF announced its intention to spin-off its Jeans business, which will include the Wrangler®, Lee® and Rock & Republic® brands, as well as the VF Outlet™ business, into an independent, publicly traded company. For the year ended March 2019, the Company incurred $131.7 million of separation and related expenses associated with the spin-off. Of these expenses, VF recognized $104.9 million in selling, general and administrative expenses and $26.8 million in cost of goods sold for the year ended March 2019. The spin-off was completed on May 22, 2019. Refer to Note 26 for additional information.
NOTE 5 — ACCOUNTS RECEIVABLE
|
| | | | | | | | | | | | | |
(In thousands) | | March 2019 | | | March 2018 | | December 2017 |
Trade | | $ | 1,625,495 |
| | | $ | 1,347,896 |
| | $ | 1,365,321 |
|
Royalty and other | | 111,677 |
| | | 85,684 |
| | 90,931 |
|
Total accounts receivable | | 1,737,172 |
| | | 1,433,580 |
| | 1,456,252 |
|
Less allowance for doubtful accounts | | 28,376 |
| | | 24,993 |
| | 26,266 |
|
Accounts receivable, net | | $ | 1,708,796 |
| | | $ | 1,408,587 |
| | $ | 1,429,986 |
|
VF has an agreement with a financial institution to sell selected trade accounts receivable on a recurring, nonrecourse basis. This agreement was amended in August 2018 to permit up to $377.5 million of VF's accounts receivable to be sold to the financial institution and remain outstanding at any point in time, compared to the $367.5 million limit in place at March 2018 and December 2017. VF removes the accounts receivable from the Consolidated Balance Sheets at the time of sale. VF does not retain any interests in the sold accounts receivable but continues to service and collect outstanding accounts receivable on behalf of the financial
institution. During the year ended March 2019, the three months ended March 2018 and the years ended December 2017 and 2016, VF sold total accounts receivable of $1,110.7 million, $258.5 million, $1,180.7 million and $1,333.9 million, respectively. As of March 2019, March 2018 and December 2017, $182.1 million, $191.2 million and $219.1 million, respectively, of the sold accounts receivable had been removed from the Consolidated Balance Sheets but remained outstanding with the financial institution. The funding fee charged by the financial institution is included in the other income (expense), net line item in the Consolidated
F-26 VF Corporation Fiscal 2019 Form 10-K
VF CORPORATION
Notes to Consolidated Financial Statements
March 2019
Statements of Income, and was $5.8 million for the year ended March 2019, $1.1 million for the three months ended March 2018, $3.9 million for the year ended December 2017 and $3.4 million
for the year ended December 2016. Net proceeds of this program are classified in operating activities in the Consolidated Statements of Cash Flows.
NOTE 6 — INVENTORIES
|
| | | | | | | | | | | | | |
(In thousands) | | March 2019 | | | March 2018 | | December 2017 |
Finished products | | $ | 1,711,264 |
| | | $ | 1,654,137 |
| | $ | 1,490,788 |
|
Work-in-process | | 114,356 |
| | | 103,757 |
| | 110,467 |
|
Raw materials | | 117,410 |
| | | 103,547 |
| | 105,354 |
|
Total inventories | | $ | 1,943,030 |
| | | $ | 1,861,441 |
| | $ | 1,706,609 |
|
NOTE 7 — PROPERTY, PLANT AND EQUIPMENT
|
| | | | | | | | | | | | | |
(In thousands) | | March 2019 | | | March 2018 |
| December 2017 |
Land and improvements | | $ | 100,715 |
| | | $ | 103,158 |
| | $ | 104,257 |
|
Buildings and improvements | | 1,113,917 |
| | | 1,076,091 |
| | 1,070,884 |
|
Machinery and equipment | | 1,377,306 |
| | | 1,295,186 |
| | 1,314,382 |
|
Property, plant and equipment, at cost | | 2,591,938 |
| | | 2,474,435 |
| | 2,489,523 |
|
Less accumulated depreciation and amortization | | 1,534,670 |
| | | 1,462,818 |
| | 1,474,885 |
|
Property, plant and equipment, net | | $ | 1,057,268 |
| | | $ | 1,011,617 |
| | $ | 1,014,638 |
|
NOTE 8 — INTANGIBLE ASSETS
|
| | | | | | | | | | | | | | | | |
(In thousands) | Weighted
Average
Amortization
Period | | Amortization
Method | | Cost | | Accumulated
Amortization | | Net
Carrying
Amount | |
March 2019 | | | | | | | | | | |
Amortizable intangible assets: | | | | | | | | | | |
Customer relationships | 17 years | | Accelerated | | $ | 341,625 |
| | $ | 143,433 |
| | $ | 198,192 |
| |
License agreements | 19 years | | Accelerated | | 7,536 |
| | 4,729 |
| | 2,807 |
| |
Trademarks | 16 years | | Straight-line | | 58,932 |
| | 12,209 |
| | 46,723 |
| |
Other | 8 years | | Straight-line | | 8,202 |
| | 4,170 |
| | 4,032 |
| |
Amortizable intangible assets, net | | | | | | | | | 251,754 |
| |
Indefinite-lived intangible assets: | | | | | | | | | | |
Trademarks and trade names | | | | | | | | | 1,772,523 |
| |
Intangible assets, net | | | | | | | | | $ | 2,024,277 |
| |
VF Corporation Fiscal 2019 Form 10-K F-27
VF CORPORATION
Notes to Consolidated Financial Statements
March 2019
|
| | | | | | | | | | | | | | | |
(In thousands) | Weighted
Average
Amortization
Period | | Amortization
Method | | Cost | | Accumulated
Amortization | | Net
Carrying
Amount |
March 2018 | | | | | | | | | |
Amortizable intangible assets: | | | | | | | | | |
Customer relationships | 18 years | | Accelerated | | $ | 344,613 |
| | $ | 143,069 |
| | $ | 201,544 |
|
License agreements | 20 years | | Accelerated | | 20,171 |
| | 13,915 |
| | 6,256 |
|
Trademarks | 16 years | | Straight-line | | 58,932 |
| | 8,309 |
| | 50,623 |
|
Other | 9 years | | Straight-line | | 9,194 |
| | 4,024 |
| | 5,170 |
|
Amortizable intangible assets, net | | | | | | | | | 263,593 |
|
Indefinite-lived intangible assets: | | | | | | | | | |
Trademarks and trade names | | | | | | | | | 1,856,517 |
|
Intangible assets, net | | | | | | | | | $ | 2,120,110 |
|
|
| | | | | | | | | | | | | | | |
(In thousands) | Weighted
Average
Amortization
Period | | Amortization
Method | | Cost | | Accumulated
Amortization | | Net
Carrying
Amount |
December 2017 | | | | | | | | | |
Amortizable intangible assets: | | | | | | | | | |
Customer relationships | 18 years | | Accelerated | | $ | 338,209 |
| | $ | 133,994 |
| | $ | 204,215 |
|
License agreements | 20 years | | Accelerated | | 19,996 |
| | 13,660 |
| | 6,336 |
|
Trademarks | 16 years | | Straight-line | | 58,932 |
| | 7,333 |
| | 51,599 |
|
Other | 9 years | | Straight-line | | 9,001 |
| | 3,648 |
| | 5,353 |
|
Amortizable intangible assets, net | | | | | | | | | 267,503 |
|
Indefinite-lived intangible assets: | | | | | | | | | |
Trademarks and trade names | | | | | | | | | 1,822,278 |
|
Intangible assets, net | | | | | | | | | $ | 2,089,781 |
|
Intangible assets decreased during the year ended March 2019 due to the divestiture of the Reef® brand business and foreign currency fluctuations, which were partially offset by the addition of intangible assets from the Icebreaker and Altra acquisitions.
VF did not record any impairment charges in the year ended March 2019, the three months ended March 2018 or the year ended December 2017. In the year ended December 2016, VF recorded an impairment charge of $40.3 million to write off the remaining trademark asset balance for the lucy® brand, which was part of the former Outdoor and Action Sports segment. Refer to Note 22 for additional information on the fair value measurements.
Amortization expense (excluding impairment charges) for the year ended March 2019, the three months ended March 2018 and the years ended December 2017 and 2016 was $30.7 million, $7.6 million, $20.0 million and $18.8 million, respectively. Estimated amortization expense for the next five fiscal years is $30.0 million, $28.5 million, $26.8 million, $25.3 million and $24.3 million, respectively.
Rock & Republic® Impairment Analysis
The Rock & Republic® brand has an exclusive wholesale distribution and licensing arrangement with Kohl's Corporation that covers all branded apparel, accessories and other merchandise. As of June 30, 2018, VF performed a quantitative impairment analysis of the Rock & Republic® amortizing trademark intangible asset to determine if the carrying value was recoverable. We determined this testing was necessary based on the expectation that certain customer contract terms would be modified. Management used the income-based relief-from-royalty method and the contractual 4% royalty rate to calculate the pre-tax undiscounted future cash flows. Based on the analysis performed, management concluded that the trademark intangible asset did not require further testing as the undiscounted cash flows exceeded the carrying value of $49.0 million.
It is possible that VF's conclusion regarding the recoverability of the intangible asset could change in future periods as there can be no assurance that the estimates and assumptions used in the analysis as of June 30, 2018 will prove to be accurate predictions of the future.
F-28 VF Corporation Fiscal 2019 Form 10-K
VF CORPORATION
Notes to Consolidated Financial Statements
March 2019
NOTE 9 — GOODWILL
Changes in goodwill are summarized by reportable segment as follows:
|
| | | | | | | | | | | | | | | | | | | | |
(In thousands) | Outdoor | | Active | | Work | | Jeans | | Total | |
Balance, December 2016 | $ | 832,937 |
| | $ | 429,354 |
| | $ | 89,011 |
| | $ | 203,365 |
| | $ | 1,554,667 |
| |
2017 acquisition | — |
| | — |
| | 92,837 |
| | — |
| | 92,837 |
| |
Currency translation | 9,337 |
| | 27,420 |
| | (140 | ) | | 8,523 |
| | 45,140 |
| |
Balance, December 2017 | 842,274 |
| | 456,774 |
| | 181,708 |
| | 211,888 |
| | 1,692,644 |
| |
Measurement period adjustment to 2017 acquisition (Note 3) | — |
| | — |
| | (9,974 | ) | | — |
| | (9,974 | ) | |
Currency translation | 2,452 |
| | 6,413 |
| | 738 |
| | 946 |
| | 10,549 |
| |
Balance, March 2018 | 844,726 |
| | 463,187 |
| | 172,472 |
| | 212,834 |
| | 1,693,219 |
| |
Fiscal 2019 acquisitions | 151,662 |
| | — |
| | — |
| | — |
| | 151,662 |
| |
Fiscal 2019 divestitures | — |
| | (48,329 | ) | | (52 | ) | | — |
| | (48,381 | ) | |
Currency translation | (12,499 | ) | | (20,902 | ) | | (1,604 | ) | | (6,611 | ) | | (41,616 | ) | |
Balance, March 2019 | $ | 983,889 |
| | $ | 393,956 |
| | $ | 170,816 |
| | $ | 206,223 |
| | $ | 1,754,884 |
| |
In connection with the realignment of the Company's segment reporting structure, the Company allocated goodwill to any newly identified reporting units using a relative fair value approach as of the first day of the first quarter of Fiscal 2019. Balances as of March 2018, December 2017 and December 2016 have been retrospectively adjusted to reflect the reallocation. Refer to Note 19 for additional information regarding the Company's reportable segments.
VF did not record any impairment charges in the year ended March 2019, the three months ended March 2018 or the year ended December 2017 based on the results of its goodwill impairment testing. In the year ended December 2016, VF recorded an impairment charge of $39.3 million to write off the remaining goodwill balance related to its lucy® brand reporting unit, which was part of the former Outdoor and Action Sports segment. Refer to Note 22 for additional information on fair value measurements.
During the three months ended March 2018, VF completed the previously announced wind down of the lucy® brand operations. As
of March 2018, VF has removed $51.6 million of goodwill and accumulated impairment charges related to the lucy® brand reporting unit, which previously had been fully impaired.
During the year ended March 2019, the Company completed the sales of the Reef® brand and Van Moer businesses, at which time the remaining goodwill of $48.4 million related to these reporting units was removed from the Consolidated Balance Sheet. Accumulated impairment charges for the goodwill removed from the Active segment were $31.1 million for the year ended March 2019. Refer to Note 4 for additional information regarding the divestitures.
There are no remaining accumulated impairment charges as of March 2019.
VF Corporation Fiscal 2019 Form 10-K F-29
VF CORPORATION
Notes to Consolidated Financial Statements
March 2019
NOTE 10 — OTHER ASSETS
|
| | | | | | | | | | | | | |
(In thousands) | | March 2019 | | | March 2018 | | December 2017 |
Computer software, net of accumulated amortization of: March 2019 - $215,491; March 2018 - $183,200; December 2017 - $171,147 | | $ | 224,601 |
| | | $ | 239,935 |
| | $ | 232,237 |
|
Investments held for deferred compensation plans (Note 15) | | 206,633 |
| | | 201,870 |
| | 203,780 |
|
Deferred income taxes (Note 18) | | 109,551 |
| | | 105,493 |
| | 103,601 |
|
Pension assets (Note 15) | | 117,405 |
| | | 76,671 |
| | 82,296 |
|
Deposits | | 53,602 |
| | | 45,321 |
| | 45,225 |
|
Partnership stores and shop-in-shop costs, net of accumulated amortization of: March 2019 - $100,125; March 2018 - $123,812; December 2017 - $118,643 | | 31,655 |
| | | 33,161 |
| | 34,149 |
|
Derivative financial instruments (Note 23) | | 9,189 |
| | | 4,659 |
| | 2,199 |
|
Other investments | | 13,071 |
| | | 12,433 |
| | 12,697 |
|
Deferred line of credit issuance costs | | 2,121 |
| | | 961 |
| | 1,078 |
|
Other | | 79,071 |
| | | 82,537 |
| | 66,413 |
|
Other assets | | $ | 846,899 |
| | | $ | 803,041 |
| | $ | 783,675 |
|
NOTE 11 — SHORT-TERM BORROWINGS
|
| | | | | | | | | | | | | |
(In thousands) | | March 2019 | | | March 2018 | | December 2017 |
Commercial paper borrowings | | $ | 650,000 |
| | | $ | 1,500,000 |
| | $ | 705,000 |
|
International borrowing arrangements | | 15,055 |
| | | 25,106 |
| | 24,384 |
|
Short-term borrowings | | $ | 665,055 |
| | | $ | 1,525,106 |
| | $ | 729,384 |
|
In December 2018, VF entered into a $2.25 billion senior unsecured revolving line of credit (the “Global Credit Facility”) that expires December 2023. The Global Credit Facility replaced VF's $2.25 billion revolving facility which was scheduled to expire in April 2020. VF may request an unlimited number of one year extensions so long as each extension does not cause the remaining life of the Global Credit Facility to exceed five years, subject to stated terms and conditions. The Global Credit Facility may be used to borrow funds in both U.S. dollar and certain non-U.S. dollar currencies, and has a $50.0 million letter of credit sublimit. In addition, the Global Credit Facility supports VF’s U.S. commercial paper program for short-term, seasonal working capital requirements and general corporate purposes, including share repurchases and acquisitions. Borrowings under the Global Credit Facility are priced at a credit spread of 81.0 basis points over the appropriate LIBOR benchmark for each currency. VF is also required to pay a facility fee to the lenders, currently equal to 6.5 basis points of the committed amount of the facility. The credit spread and facility fee are subject to adjustment based on VF’s credit ratings. The prior revolving credit facility was priced at a credit spread of 80.5 basis points over the appropriate LIBOR benchmark for each currency and VF was required to pay a facility fee to the lenders equal to 7.0 basis points of the committed amount of the facility.
The Global Credit Facility contains certain restrictive covenants, which include maintenance of a consolidated indebtedness to consolidated capitalization ratio, as defined therein, equal to or
below 60%. If VF fails in the performance of any covenants, the lenders may terminate their obligation to make advances and declare any outstanding obligations to be immediately due and payable. As of March 2019, VF was in compliance with all covenants.
VF’s commercial paper program allows for borrowings of up to $2.25 billion to the extent it has borrowing capacity under the Global Credit Facility. Outstanding commercial paper borrowings totaled $650.0 million, $1.50 billion and $705.0 million at March 2019, March 2018 and December 2017, respectively. The Global Credit Facility also had $15.3 million of outstanding standby letters of credit issued on behalf of VF as of March 2019, March 2018 and December 2017, leaving $1.58 billion, $734.7 million and $1.53 billion as of March 2019, March 2018 and December 2017, respectively, available for borrowing against this facility.
VF has $179.5 million of international lines of credit with various banks, which are uncommitted and may be terminated at any time by either VF or the banks. Total outstanding balances under these arrangements were $15.1 million, $25.1 million and $24.4 million at March 2019, March 2018 and December 2017, respectively. Borrowings under these arrangements had a weighted average interest rate of 24.6%, 12.0% and 9.9% at March 2019, March 2018 and December 2017, respectively, excluding accepted letters of credit which are non-interest bearing to VF. The interest-bearing borrowings include short-term borrowings in Argentina.
F-30 VF Corporation Fiscal 2019 Form 10-K
VF CORPORATION
Notes to Consolidated Financial Statements
March 2019
NOTE 12 — ACCRUED LIABILITIES
|
| | | | | | | | | | | | | |
(In thousands) | | March 2019 | | | March 2018 | | December 2017 |
Compensation | | $ | 341,988 |
| | | $ | 135,247 |
| | $ | 249,929 |
|
Customer discounts and allowances | | 225,484 |
| | | 28,604 |
| | 46,169 |
|
Other taxes | | 153,355 |
| | | 160,173 |
| | 155,969 |
|
Income taxes | | 68,054 |
| | | 67,417 |
| | 134,837 |
|
Restructuring | | 86,602 |
| | | 42,757 |
| | 32,438 |
|
Advertising | | 40,938 |
| | | 40,322 |
| | 48,554 |
|
Freight, duties and postage | | 40,703 |
| | | 46,281 |
| | 43,584 |
|
Deferred compensation (Note 15) | | 18,226 |
| | | 33,590 |
| | 38,885 |
|
Interest | | 23,250 |
| | | 25,483 |
| | 16,317 |
|
Derivative financial instruments (Note 23) | | 18,590 |
| | | 96,087 |
| | 87,205 |
|
Insurance | | 15,634 |
| | | 18,867 |
| | 17,814 |
|
Product warranty claims (Note 14) | | 12,618 |
| | | 12,862 |
| | 12,833 |
|
Pension liabilities (Note 15) | | 10,260 |
| | | 32,814 |
| | 27,277 |
|
Other | | 240,851 |
| | | 197,923 |
| | 234,724 |
|
Accrued liabilities | | $ | 1,296,553 |
| | | $ | 938,427 |
| | $ | 1,146,535 |
|
NOTE 13 — LONG-TERM DEBT
|
| | | | | | | | | | | | | |
(In thousands) | | March 2019 | | | March 2018 | | December 2017 |
3.50% notes, due 2021 | | $ | 498,450 |
| | | $ | 497,852 |
| | $ | 497,705 |
|
0.625% notes, due 2023 | | 949,049 |
| | | 1,041,577 |
| | 1,015,500 |
|
6.00% notes, due 2033 | | 292,982 |
| | | 292,648 |
| | 292,568 |
|
6.45% notes, due 2037 | | 346,534 |
| | | 346,346 |
| | 346,300 |
|
Capital leases | | 34,132 |
| | | 40,397 |
| | 41,881 |
|
Total long-term debt | | 2,121,147 |
| | | 2,218,820 |
| | 2,193,954 |
|
Less current portion | | 5,263 |
| | | 6,265 |
| | 6,165 |
|
Long-term debt, due beyond one year | | $ | 2,115,884 |
| | | $ | 2,212,555 |
| | $ | 2,187,789 |
|
Interest payments are due annually on the 2023 notes and semiannually on all other notes.
All notes, along with any amounts outstanding under the Global Credit Facility (Note 11), rank equally as senior unsecured obligations of VF. All notes contain customary covenants and events of default, including limitations on liens and sale-leaseback transactions and a cross-acceleration event of default. The cross-acceleration provision of the 2033 notes is triggered if more than $50.0 million of other debt is in default and has been accelerated by the lenders. For the other notes, the cross-acceleration trigger is $100.0 million. If VF fails in the performance of any covenant under the indentures that govern the respective notes, the trustee or lenders may declare the principal due and payable immediately. As of March 2019, VF was in compliance with all covenants. None of the long-term debt agreements contain acceleration of maturity clauses based solely on changes in credit ratings. However, if there were a change in control of VF and, as a result of the change in control, the 2021, 2023 and 2037 notes were rated below investment grade by recognized rating agencies, then VF would be obligated to repurchase those notes at 101% of the aggregate principal amount plus any accrued interest.
VF may redeem its notes, in whole or in part, at a price equal to the greater of (i) 100% of the principal amount, plus accrued interest to the redemption date, or (ii) the sum of the present value of the remaining scheduled payments of principal and interest discounted to the redemption date at an adjusted treasury rate, as defined, plus 20 basis points for the 2021 notes, 15 basis points for the 2023 and 2033 notes, and 25 basis points for the 2037 notes, plus accrued interest to the redemption date. In addition, the 2021 and 2023 notes can be redeemed at 100% of the principal amount plus accrued interest to the redemption date within the three months prior to maturity.
The 2021 notes have a principal balance of $500.0 million and are recorded net of unamortized original issue discount and debt issuance costs. Interest expense on these notes is recorded at an effective annual interest rate of 4.69%, including amortization of a deferred loss on an interest rate hedging contract (Note 23), original issue discount and debt issuance costs.
The 2023 notes have a principal balance of €850.0 million and are recorded net of unamortized original issue discount and debt issuance costs. Interest expense on these notes is recorded at an
VF Corporation Fiscal 2019 Form 10-K F-31
VF CORPORATION
Notes to Consolidated Financial Statements
March 2019
effective annual interest rate of 0.712% which includes amortization of original issue discount and debt issuance costs. The Company has designated these notes as a net investment hedge of VF's investment in certain foreign operations. Refer to Note 23 for additional information.
The 2033 notes have a principal balance of $300.0 million and are recorded net of unamortized original issue discount and debt issuance costs. Interest expense on these notes is recorded at an effective annual interest rate of 6.19%, including amortization of a deferred gain on an interest rate hedging contract (Note 23), original issue discount and debt issuance costs.
The 2037 notes have a principal balance of $350.0 million and are recorded net of unamortized debt issuance costs.
Capital leases relate primarily to buildings and improvements (Note 7), expire at dates through 2036 and have an effective interest rate of 3.37%. Assets under capital leases are included in property, plant and equipment at a cost of $66.2 million, less accumulated amortization of $40.6 million, $35.2 million and $33.8 million at March 2019, March 2018 and December 2017, respectively.
The scheduled payments of long-term debt and future minimum lease payments for capital leases at the end of Fiscal 2019 for the next five fiscal years and thereafter are summarized as follows:
|
| | | | | | | | | | | |
(In thousands) | Notes and Other | | Capital Leases | | Total |
2020 | $ | — |
| | $ | 6,293 |
| | $ | 6,293 |
|
2021 | — |
| | 6,040 |
| | 6,040 |
|
2022 | 500,000 |
| | 2,287 |
| | 502,287 |
|
2023 | — |
| | 1,614 |
| | 1,614 |
|
2024 | 953,785 |
| | 1,691 |
| | 955,476 |
|
Thereafter | 650,000 |
| | 23,495 |
| | 673,495 |
|
| 2,103,785 |
| | 41,420 |
| | 2,145,205 |
|
Less unamortized debt discount | 6,531 |
| | — |
| | 6,531 |
|
Less unamortized debt issuance costs | 10,239 |
| | — |
| | 10,239 |
|
Less amounts representing interest | — |
| | 7,288 |
| | 7,288 |
|
Total long-term debt | 2,087,015 |
| | 34,132 |
| | 2,121,147 |
|
Less current portion | — |
| | 5,263 |
| | 5,263 |
|
Long-term debt, due beyond one year | $ | 2,087,015 |
| | $ | 28,869 |
| | $ | 2,115,884 |
|
NOTE 14 — OTHER LIABILITIES
|
| | | | | | | | | | | | | |
(In thousands) | | March 2019 | | | March 2018 | | December 2017 |
Deferred income taxes (Note 18) | | $ | 68,864 |
| | | $ | 40,887 |
| | $ | 58,036 |
|
Deferred compensation (Note 15) | | 181,110 |
| | | 198,780 |
| | 201,116 |
|
Income taxes | | 629,176 |
| | | 632,321 |
| | 628,713 |
|
Pension liabilities (Note 15) | | 174,982 |
| | | 176,582 |
| | 189,191 |
|
Deferred rent credits | | 96,276 |
| | | 87,267 |
| | 85,857 |
|
Product warranty claims | | 49,301 |
| | | 49,689 |
| | 49,733 |
|
Derivative financial instruments (Note 23) | | 3,747 |
| | | 10,087 |
| | 12,833 |
|
Other | | 77,325 |
| | | 76,217 |
| | 81,234 |
|
Other liabilities | | $ | 1,280,781 |
| | | $ | 1,271,830 |
| | $ | 1,306,713 |
|
F-32 VF Corporation Fiscal 2019 Form 10-K
VF CORPORATION
Notes to Consolidated Financial Statements
March 2019
VF accrues warranty costs at the time revenue is recognized. Product warranty costs are estimated based on historical experience and specific identification of the product requirements, which may fluctuate based on product mix. Activity relating to accrued product warranty claims is summarized as follows:
|
| | | | | | | | | | | | | | | | | |
| | Year Ended March | | | Three Months Ended March (Transition Period) | | Year Ended December |
(In thousands) | | 2019 | | | 2018 | | 2017 | | 2016 |
Balance, beginning of year | | $ | 62,551 |
| | | $ | 62,566 |
| | $ | 62,872 |
| | $ | 63,114 |
|
Accrual for products sold during the year | | 13,082 |
| | | 3,828 |
| | 10,584 |
| | 12,022 |
|
Repair or replacement costs incurred | | (12,778 | ) | | | (4,126 | ) | | (12,654 | ) | | (11,956 | ) |
Currency translation | | (936 | ) | | | 283 |
| | 1,764 |
| | (308 | ) |
Balance, end of year | | 61,919 |
| | | 62,551 |
| | 62,566 |
| | 62,872 |
|
Less current portion (Note 12) | | 12,618 |
| | | 12,862 |
| | 12,833 |
| | 12,993 |
|
Long-term portion | | $ | 49,301 |
| | | $ | 49,689 |
| | $ | 49,733 |
| | $ | 49,879 |
|
NOTE 15 — RETIREMENT AND SAVINGS BENEFIT PLANS
VF has several retirement and savings benefit plans covering eligible employees. VF retains the right to curtail or discontinue any of the plans, subject to local regulations.
Defined Benefit Pension Plans
Defined benefit plans provide pension benefits based on participant compensation and years of service. VF sponsors a noncontributory qualified defined benefit pension plan covering most full-time U.S. employees employed before 2005 (the “U.S. qualified plan”) and an unfunded supplemental defined benefit pension plan that provides benefits in excess of limitations imposed by income tax regulations
(the “U.S. nonqualified plan”). The U.S. qualified plan is fully funded at the end of Fiscal 2019, and VF’s net underfunded status primarily relates to obligations under the unfunded U.S. nonqualified plan. The U.S. qualified and nonqualified plans comprise 91% of VF’s total defined benefit plan assets and 88% of VF’s total projected benefit obligations at March 2019, and the remainder relates to non-U.S. defined benefit plans. A March 31 measurement date is used to value plan assets and obligations for all pension plans.
The amounts reported in these disclosures have not been segregated between continuing and discontinued operations.
The components of pension cost for VF’s defined benefit plans were as follows:
|
| | | | | | | | | | | | | | | | | |
| | Year Ended March | | | Three Months Ended March (Transition Period) | | Year Ended December |
(In thousands) | | 2019 | | | 2018 | | 2017 | | 2016 |
Service cost — benefits earned during the period | | $ | 22,352 |
| | | $ | 5,912 |
| | $ | 24,890 |
| | $ | 25,839 |
|
Interest cost on projected benefit obligations | | 63,434 |
| | | 14,825 |
| | 58,989 |
| | 68,020 |
|
Expected return on plan assets | | (93,409 | ) | | | (25,314 | ) | | (94,807 | ) | | (99,540 | ) |
Settlement charges | | 8,856 |
| | | — |
| | — |
| | 50,922 |
|
Curtailments | | 9,530 |
| | | — |
| | 1,671 |
| | — |
|
Amortization of deferred amounts: | | | | | | | | | |
Net deferred actuarial losses | | 28,474 |
| | | 8,548 |
| | 41,440 |
| | 65,212 |
|
Deferred prior service costs | | 494 |
| | | 647 |
| | 2,646 |
| | 2,584 |
|
Total pension expense | | $ | 39,731 |
| | | $ | 4,618 |
| | $ | 34,829 |
| | $ | 113,037 |
|
Weighted average actuarial assumptions used to determine pension expense: | | | | | | | | | |
Discount rate in effect for determining service cost | | 3.85 | % | | | 3.58 | % | | 4.08 | % | | 4.54 | % |
Discount rate in effect for determining interest cost | | 3.51 | % | | | 3.13 | % | | 3.26 | % | | 3.56 | % |
Expected long-term return on plan assets | | 5.58 | % | | | 5.72 | % | | 5.72 | % | | 5.81 | % |
Rate of compensation increase | | 3.73 | % | | | 3.73 | % | | 3.78 | % | | 3.90 | % |
VF Corporation Fiscal 2019 Form 10-K F-33
VF CORPORATION
Notes to Consolidated Financial Statements
March 2019
In Fiscal 2019, VF approved a freeze of all future benefit accruals under the U.S. qualified and U.S. nonqualified plans, effective December 31, 2018. Accordingly, the Company recognized a $9.5 million pension curtailment loss in the other income (expense), net line item in the Consolidated Statement of Income for the year ended March 2019.
In the year ended December 2017, the Company recorded curtailment charges of $1.7 million which comprised (i) $1.1 million within the U.S. qualified plan related to the sale of the Licensing Business (recorded in the income (loss) from discontinued operations, net of tax line item), and (ii) $0.6 million within the U.S. nonqualified plan related to restructuring initiatives (recorded in the other income (expense), net line item in the Consolidated Statement of Income).
In the year ended March 2019, VF reported $8.9 million in settlement charges in the other income (expense), net line item in
the Consolidated Statement of Income related to the recognition of deferred actuarial losses resulting from lump sum payments of retirement benefits in the supplemental defined benefit pension plan.
In the year ended December 2016, the Company offered former employees in the U.S. qualified plan a one-time option to receive a distribution of their deferred vested benefits. Approximately 9,400 participants accepted a distribution, representing 66% of eligible participants and a 23% reduction in the total number of plan participants at the beginning of the year. In December 2016, the plan paid $197.1 million in lump-sum distributions to settle $224.7 million of projected benefit obligations related to these participants. VF recorded $50.9 million in settlement charges during the year ended December 2016 to recognize the related deferred actuarial losses in accumulated OCI.
The following provides a reconciliation of the changes in fair value of VF’s defined benefit plan assets and projected benefit obligations for each period, and the funded status at the end of each period:
|
| | | | | | | | | | | | | |
(In thousands) | | March 2019 | | | March 2018 | | December 2017 |
Fair value of plan assets, beginning of period | | $ | 1,751,760 |
| | | $ | 1,809,649 |
| | $ | 1,673,297 |
|
Actual return on plan assets | | 82,947 |
| | | (39,495 | ) | | 204,017 |
|
VF contributions | | 41,581 |
| | | 3,205 |
| | 9,807 |
|
Participant contributions | | 4,136 |
| | | 1,018 |
| | 4,011 |
|
Benefits paid | | (118,513 | ) | | | (27,441 | ) | | (93,900 | ) |
Currency translation | | (10,817 | ) | | | 4,824 |
| | 12,417 |
|
Fair value of plan assets, end of period | | 1,751,094 |
| | | 1,751,760 |
| | 1,809,649 |
|
Projected benefit obligations, beginning of period | | 1,884,485 |
| | | 1,943,821 |
| | 1,808,327 |
|
Service cost | | 22,352 |
| | | 5,912 |
| | 24,890 |
|
Interest cost | | 63,434 |
| | | 14,825 |
| | 58,989 |
|
Participant contributions | | 4,136 |
| | | 1,018 |
| | 4,011 |
|
Actuarial loss (gain) | | 10,653 |
| | | (59,511 | ) | | 131,040 |
|
Benefits paid | | (118,513 | ) | | | (27,441 | ) | | (93,900 | ) |
Plan amendments | | 715 |
| | | — |
| | — |
|
Curtailments | | (33,826 | ) | | | — |
| | (5,664 | ) |
Currency translation | | (14,505 | ) | | | 5,861 |
| | 16,128 |
|
Projected benefit obligations, end of period | | 1,818,931 |
| | | 1,884,485 |
| | 1,943,821 |
|
Funded status, end of period | | $ | (67,837 | ) | | | $ | (132,725 | ) | | $ | (134,172 | ) |
Pension benefits are reported in the Consolidated Balance Sheets as a net asset or liability based on the overfunded or underfunded status of the defined benefit plans, assessed on a plan-by-plan basis.
F-34 VF Corporation Fiscal 2019 Form 10-K
VF CORPORATION
Notes to Consolidated Financial Statements
March 2019
|
| | | | | | | | | | | | | |
(In thousands) | | March 2019 | | | March 2018 | | December 2017 |
Amounts included in Consolidated Balance Sheets: | | | | | | | |
Other assets (Note 10) | | $ | 117,405 |
| | | $ | 76,671 |
| | $ | 82,296 |
|
Accrued liabilities (Note 12) | | (10,260 | ) | | | (32,814 | ) | | (27,277 | ) |
Other liabilities (Note 14) | | (174,982 | ) | | | (176,582 | ) | | (189,191 | ) |
Funded status | | $ | (67,837 | ) | | | $ | (132,725 | ) | | $ | (134,172 | ) |
Accumulated other comprehensive loss, pretax: | | | | | | | |
Net deferred actuarial losses | | $ | 399,093 |
| | | $ | 452,329 |
| | $ | 454,463 |
|
Deferred prior service costs | | 563 |
| | | 9,878 |
| | 10,533 |
|
Total accumulated other comprehensive loss, pretax | | $ | 399,656 |
| | | $ | 462,207 |
| | $ | 464,996 |
|
Accumulated benefit obligations | | $ | 1,778,910 |
| | | $ | 1,783,600 |
| | $ | 1,837,776 |
|
Weighted average actuarial assumptions used to determine pension obligations: | | | | | | | |
Discount rate | | 3.68 | % | | | 3.76 | % | | 3.46 | % |
Rate of compensation increase (a) | | 2.74 | % | | | 3.73 | % | | 3.73 | % |
| |
(a) | Rate of compensation increase is calculated as the weighted average rate of compensation increase for active plans. Frozen plans are excluded from the calculation. |
Accumulated benefit obligations at any measurement date are the present value of vested and unvested pension benefits earned, without considering projected future compensation increases. Projected benefit obligations are the present value of vested and unvested pension benefits earned, considering projected future compensation increases.
Deferred actuarial gains and losses are changes in the amount of either the benefit obligation or the value of plan assets resulting from differences between expected amounts for a year using actuarial assumptions and the actual results for that year. These amounts are deferred as a component of accumulated OCI and amortized to pension expense in future years. For the U.S. qualified plan, amounts in excess of 20% of projected benefit obligations at the beginning of the year are amortized over five years; amounts between (i) 10% of the greater of projected benefit obligations or plan assets, and (ii) 20% of projected benefit obligations are amortized over the expected average life expectancy of all participants; and amounts less than the greater of 10% of projected benefit obligations or plan assets are not amortized. For the U.S. nonqualified plan, amounts in excess of 10% of the pension benefit obligations are amortized on a straight-line basis over the expected average life expectancy of all participants.
Deferred prior service costs related to plan amendments are also recorded in accumulated OCI and amortized to pension expense on a straight-line basis over the average remaining years of service for active employees.
The estimated amounts of accumulated OCI to be amortized to pension expense in Fiscal 2020 are $16.0 million of deferred actuarial losses and an insignificant amount of deferred prior service costs.
Management’s investment objectives are to invest plan assets in a diversified portfolio of securities to provide long-term growth,
minimize the volatility of the value of plan assets relative to plan liabilities, and to ensure plan assets are sufficient to pay the benefit obligations. Investment strategies focus on diversification among multiple asset classes, a balance of long-term investment return at an acceptable level of risk and liquidity to meet benefit payments. The primary objective of the investment strategies is to more closely align plan assets with plan liabilities by utilizing dynamic asset allocation targets dependent upon changes in the plan’s funded ratio, capital market expectations and risk tolerance.
Plan assets are primarily composed of common collective trust funds that invest in liquid securities diversified across equity, fixed-income, real estate and other asset classes. Fund assets are allocated among independent investment managers who have full discretion to manage their portion of the fund’s assets, subject to strategy and risk guidelines established with each manager. The overall strategy, the resulting allocations of plan assets and the performance of funds and individual investment managers are continually monitored. Derivative financial instruments may be used by investment managers for hedging purposes to gain exposure to alternative asset classes through the futures markets. There are no direct investments in VF debt or equity securities and no significant concentrations of security risk.
The expected long-term rate of return on plan assets was based on an evaluation of the weighted average expected returns for the major asset classes in which the plans have invested. Expected returns by asset class were developed through analysis of historical market returns, current market conditions, inflation expectations and equity and credit risks. Inputs from various investment advisors on long-term capital market returns and other variables were also considered where appropriate.
VF Corporation Fiscal 2019 Form 10-K F-35
VF CORPORATION
Notes to Consolidated Financial Statements
March 2019
The fair value of investments held by VF’s defined benefit plans at March 2019, March 2018 and December 2017, by asset class, is summarized below. Refer to Note 22 for a description of the three levels of the fair value measurement hierarchy.
|
| | | | | | | | | | | | | | | | |
| Total Plan Assets | | Fair Value Measurements | |
(In thousands) | Level 1 | | Level 2 | | Level 3 | |
March 2019 | | | | | | | | |
Plan assets | | | | | | | | |
Cash equivalents | $ | 3,023 |
| | $ | 3,023 |
| | $ | — |
| | $ | — |
| |
Fixed income securities: | | | | | | | | |
U.S. Treasury and government agencies | 7 |
| | — |
| | 7 |
| | — |
| |
Insurance contracts | 71,521 |
| | — |
| | 71,521 |
| | — |
| |
Commodities | (347 | ) | | (347 | ) | | — |
| | — |
| |
Total plan assets in the fair value hierarchy | $ | 74,204 |
| | $ | 2,676 |
| | $ | 71,528 |
| | $ | — |
| |
Plan assets measured at net asset value | | | | | | | | |
Cash equivalents | 36,349 |
| | | | | | | |
Equity securities: | | | | | | | | |
Domestic | 82,659 |
| | | | | | | |
International | 97,766 |
| | | | | | | |
Fixed income securities: | | | | | | | | |
Corporate and international bonds | 1,309,123 |
| | | | | | | |
Alternative investments | 150,993 |
| | | | | | | |
Total plan assets measured at net asset value | 1,676,890 |
| | | | | | | |
Total plan assets | $ | 1,751,094 |
| | | | | | | |
|
| | | | | | | | | | | | | | | |
| Total Plan Assets | | Fair Value Measurements |
(In thousands) | Level 1 | | Level 2 | | Level 3 |
March 2018 | | | | | | | |
Plan assets | | | | | | | |
Cash equivalents | $ | 14,694 |
| | $ | 14,694 |
| | $ | — |
| | $ | — |
|
Fixed income securities: | | | | | | | |
U.S. Treasury and government agencies | 8 |
| | — |
| | 8 |
| | — |
|
Insurance contracts | 67,444 |
| | — |
| | 67,444 |
| | — |
|
Commodities | (7,091 | ) | | (7,091 | ) | | — |
| | — |
|
Total plan assets in the fair value hierarchy | $ | 75,055 |
| | $ | 7,603 |
| | $ | 67,452 |
| | $ | — |
|
Plan assets measured at net asset value | | | | | | | |
Cash equivalents | 38,833 |
| | | | | | |
Equity securities: | | | | | | | |
Domestic | 114,958 |
| | | | | | |
International | 155,330 |
| | | | | | |
Fixed income securities: | | | | | | | |
Corporate and international bonds | 1,211,103 |
| | | | | | |
Alternative investments | 156,481 |
| | | | | | |
Total plan assets measured at net asset value | 1,676,705 |
| | | | | | |
Total plan assets | $ | 1,751,760 |
| | | | | | |
F-36 VF Corporation Fiscal 2019 Form 10-K
VF CORPORATION
Notes to Consolidated Financial Statements
March 2019
|
| | | | | | | | | | | | | | | |
| Total Plan Assets | | Fair Value Measurements |
(In thousands) | Level 1 | | Level 2 | | Level 3 |
December 2017 | | | | | | | |
Plan assets | | | | | | | |
Cash equivalents | $ | 8,191 |
| | $ | 8,191 |
| | $ | — |
| | $ | — |
|
Fixed income securities: | | | | | | | |
U.S. Treasury and government agencies | 8 |
| | — |
| | 8 |
| | — |
|
Insurance contracts | 69,448 |
| | — |
| | 69,448 |
| | — |
|
Commodities | (372 | ) | | (372 | ) | | — |
| | — |
|
Total plan assets in the fair value hierarchy | $ | 77,275 |
| | $ | 7,819 |
| | $ | 69,456 |
| | $ | — |
|
Plan assets measured at net asset value | | | | | | | |
Cash equivalents | 36,313 |
| | | | | | |
Equity securities: | | | | | | | |
Domestic | 152,154 |
| | | | | | |
International | 173,608 |
| | | | | | |
Fixed income securities: | | | | | | | |
Corporate and international bonds | 1,215,558 |
| | | | | | |
Alternative investments | 154,741 |
| | | | | | |
Total plan assets measured at net asset value | 1,732,374 |
| | | | | | |
Total plan assets | $ | 1,809,649 |
| | | | | | |
Cash equivalents include cash held by individual investment managers of other asset classes for liquidity purposes (Level 1), and an institutional fund that invests primarily in short-term U.S. government securities measured at their daily net asset value. The fair values of insurance contracts are provided by the insurance companies and are primarily based on accumulated contributions plus returns guaranteed by the insurers (Level 2). Commodities consist of derivative commodity futures contracts (Level 1).
Equity and fixed-income securities generally represent institutional funds measured at their daily net asset value derived from quoted prices of the underlying investments. Alternative investments are primarily in funds of hedge funds (“FoHFs”), which are comprised of different and independent hedge funds with various investment strategies. The administrators of the FoHFs utilize unobservable inputs to calculate the net asset value of the FoHFs on a monthly basis.
VF makes contributions to its defined benefit plans sufficient to meet minimum funding requirements under applicable laws, plus discretionary amounts as determined by management. VF does not currently plan to make any contributions to the U.S. qualified plan during Fiscal 2020, and intends to make approximately $17.7 million of contributions to its other defined benefit plans during Fiscal 2020. The estimated future benefit payments for all of VF’s defined benefit plans, on a calendar year basis, are approximately $94.6 million in 2020, $96.2 million in 2021, $99.2 million in 2022, $101.3 million in 2023, $103.1 million in 2024 and $531.3 million for the years 2025 through 2029.
Other Retirement and Savings Plans
VF sponsors a nonqualified retirement savings plan for employees whose contributions to a 401(k) plan would be limited by provisions of the Internal Revenue Code. This plan allows participants to defer
a portion of their compensation and to receive matching contributions for a portion of the deferred amounts. Participants earn a return on their deferred compensation based on their selection of a hypothetical portfolio of publicly traded mutual funds and a separately managed fixed-income fund. Changes in the fair value of the participants’ hypothetical investments are recorded as an adjustment to deferred compensation liabilities and compensation expense. Expense under this plan was $1.7 million in the year ended March 2019, $0.5 million in the three months ended March 2018, $1.3 million in the year ended December 2017 and $1.7 million in the year ended December 2016. Deferred compensation, including accumulated earnings, is distributable in cash at participant-specified dates upon retirement, death, disability or termination of employment. VF sponsors a similar nonqualified plan that permits nonemployee members of the Board of Directors to defer their Board compensation. VF also has remaining obligations under other deferred compensation plans, primarily related to acquired companies. At March 2019, VF’s liability to participants under all deferred compensation plans was $199.3 million, of which $18.2 million was recorded in accrued liabilities (Note 12) and $181.1 million was recorded in other liabilities (Note 14).
VF has purchased (i) publicly traded mutual funds and a separately managed fixed-income fund in the same amounts as most of the participant-directed hypothetical investments underlying the deferred compensation liabilities, and (ii) variable life insurance contracts that invest in institutional funds that are substantially the same as the participant-directed hypothetical investments. These investment securities and earnings thereon are intended to provide a source of funds to meet the deferred compensation obligations, and serve as an economic hedge of the financial impact of changes in deferred compensation liabilities. They are held in an irrevocable trust but are subject to claims of creditors in the event of VF’s insolvency. VF also has assets related to deferred compensation
VF Corporation Fiscal 2019 Form 10-K F-37
VF CORPORATION
Notes to Consolidated Financial Statements
March 2019
plans of acquired companies, which are primarily invested in life insurance contracts. At March 2019, the fair value of investments held for all deferred compensation plans was $224.4 million, of which $17.8 million was recorded in other current assets and $206.6 million was recorded in other assets (Note 10). Realized and unrealized gains and losses on these deferred compensation assets are recorded in compensation expense in the Consolidated Statements of Income and substantially offset losses and gains resulting from changes in deferred compensation liabilities to participants.
VF sponsors 401(k) plans as well as other domestic and foreign retirement and savings plans. Expense for these plans totaled $46.4 million in the year ended March 2019, $16.8 million in the three months ended March 2018, $41.2 million in the year ended December 2017 and $39.7 million in the year ended December 2016.
NOTE 16 — CAPITAL AND ACCUMULATED OTHER COMPREHENSIVE INCOME (LOSS)
Common Stock
During the year ended March 2019, the Company purchased 1.9 million shares of Common Stock in open market transactions for $150.0 million under its share repurchase program authorized by VF’s Board of Directors. These transactions were treated as treasury stock transactions.
Common Stock outstanding is net of shares held in treasury which are, in substance, retired. During the year ended March 2019, the three months ended March 2018 and the years ended December 2017 and 2016, VF restored 2.2 million, 3.4 million, 22.3 million and 16.1 million treasury shares, respectively, to an unissued status, after which they were no longer recognized as shares held in
treasury. There were no shares held in treasury at the end of March 2019, March 2018, December 2017 or December 2016. The excess of the cost of treasury shares acquired over the $0.25 per share stated value of Common Stock is deducted from retained earnings.
VF Common Stock was also held by the Company’s deferred compensation plans (Note 15) and was treated as treasury shares for financial reporting purposes. During the year ended March 2019, the Company purchased 7,680 shares of Common Stock in open market transactions for $0.7 million. As of March 2019, there were no shares held in the Company's deferred compensation plans.
Balances related to shares held for deferred compensation plans were as follows:
|
| | | | | | | | | | | | | | | | | |
| | Year Ended March | | | Three Months Ended March (Transition Period) | | Year Ended December |
(In thousands, except share amounts) | | 2019 | | | 2018 | | 2017 | | 2016 |
Shares held for deferred compensation plans | | — |
| | | 284,785 |
| | 317,515 |
| | 439,667 |
|
Cost of shares held for deferred compensation plans | | $ | — |
| | | $ | 3,621 |
| | $ | 3,901 |
| | $ | 5,464 |
|
Accumulated Other Comprehensive Income (Loss)
Comprehensive income consists of net income and specified components of OCI, which relates to changes in assets and liabilities that are not included in net income under GAAP but are instead deferred and accumulated within a separate component of stockholders’ equity in the balance sheet. VF’s comprehensive income is presented in the Consolidated Statements of Comprehensive Income. The deferred components of OCI are reported, net of related income taxes, in accumulated OCI in stockholders’ equity, as follows:
|
| | | | | | | | | | | | | |
(In thousands) | | March 2019 | | | March 2018 | | December 2017 |
Foreign currency translation and other | | $ | (725,679 | ) | | | $ | (476,869 | ) | | $ | (546,201 | ) |
Defined benefit pension plans | | (243,184 | ) | | | (289,618 | ) | | (291,949 | ) |
Derivative financial instruments | | 66,788 |
| | | (97,543 | ) | | (87,990 | ) |
Accumulated other comprehensive income (loss) | | $ | (902,075 | ) | | | $ | (864,030 | ) | | $ | (926,140 | ) |
F-38 VF Corporation Fiscal 2019 Form 10-K
VF CORPORATION
Notes to Consolidated Financial Statements
March 2019
The changes in accumulated OCI, net of related taxes, are as follows:
|
| | | | | | | | | | | | | | | | |
(In thousands) | Foreign Currency Translation and Other | | Defined
Benefit
Pension Plans | | Derivative
Financial
Instruments | | Total | |
Balance, December 2015 | $ | (718,169 | ) | | $ | (372,195 | ) | | $ | 47,142 |
| | $ | (1,043,222 | ) | |
Other comprehensive income (loss) before reclassifications | (76,410 | ) | | (4,357 | ) | | 81,036 |
| | 269 |
| |
Amounts reclassified from accumulated other comprehensive income (loss) | — |
| | 73,855 |
| | (72,365 | ) | | 1,490 |
| |
Net other comprehensive income (loss) | (76,410 | ) | | 69,498 |
| | 8,671 |
| | 1,759 |
| |
Balance, December 2016 | (794,579 | ) | | (302,697 | ) | | 55,813 |
| | (1,041,463 | ) | |
Other comprehensive income (loss) before reclassifications | 248,378 |
| | (17,970 | ) | | (123,080 | ) | | 107,328 |
| |
Amounts reclassified from accumulated other comprehensive income (loss) | — |
| | 28,718 |
| | (20,723 | ) | | 7,995 |
| |
Net other comprehensive income (loss) | 248,378 |
| | 10,748 |
| | (143,803 | ) | | 115,323 |
| |
Balance, December 2017 | (546,201 | ) | | (291,949 | ) | | (87,990 | ) | | (926,140 | ) | |
Other comprehensive income (loss) before reclassifications | 69,332 |
| | (4,852 | ) | | (21,078 | ) | | 43,402 |
| |
Amounts reclassified from accumulated other comprehensive income (loss) | — |
| | 7,183 |
| | 11,525 |
| | 18,708 |
| |
Net other comprehensive income (loss) | 69,332 |
| | 2,331 |
| | (9,553 | ) | | 62,110 |
| |
Balance, March 2018 | (476,869 | ) | | (289,618 | ) | | (97,543 | ) | | (864,030 | ) | |
Other comprehensive income (loss) before reclassifications | (248,810 | ) | | 10,444 |
| | 137,218 |
| | (101,148 | ) | |
Amounts reclassified from accumulated other comprehensive income (loss) | — |
| | 35,990 |
| | 27,113 |
| | 63,103 |
| |
Net other comprehensive income (loss) | (248,810 | ) | | 46,434 |
| | 164,331 |
| | (38,045 | ) | |
Balance, March 2019 | $ | (725,679 | ) | | $ | (243,184 | ) | | $ | 66,788 |
| | $ | (902,075 | ) | |
VF Corporation Fiscal 2019 Form 10-K F-39
VF CORPORATION
Notes to Consolidated Financial Statements
March 2019
Reclassifications out of accumulated OCI are as follows:
|
| | | | | | | | | | | | | | | | | | | | |
| | (In thousands) | Affected Line Item in the Consolidated Statements of Income | | | Year Ended March | | | Three Months Ended March (Transition Period) | | Year Ended December |
| | Details About Accumulated Other
Comprehensive Income (Loss) Components | | | | | |
| | | | 2019 | | | 2018 | | 2017 | | 2016 |
| | Amortization of defined benefit pension plans: | | | | | | | | | | |
| | Net deferred actuarial losses | Other income (expense), net | | | $ | (28,474 | ) | | | $ | (8,548 | ) | | $ | (41,440 | ) | | $ | (65,212 | ) |
| | Deferred prior service costs | Other income (expense), net | | | (494 | ) | | | (647 | ) | | (2,646 | ) | | (2,584 | ) |
| | Pension settlement charges | Other income (expense), net | | | (8,856 | ) | | | — |
| | — |
| | (50,922 | ) |
| | Pension curtailment losses | Other income (expense), net | | | (9,530 | ) | | | — |
| | (566 | ) | | — |
|
| | Pension curtailment loss | Income (loss) from discontinued operations, net of tax | | | — |
| | | — |
| | (1,105 | ) | | — |
|
| |
| | Total before tax | | | | (47,354 | ) | | | (9,195 | ) | | (45,757 | ) | | (118,718 | ) |
| | Tax benefit | | | | 11,364 |
| | | 2,012 |
| | 17,039 |
| | 44,863 |
|
| | Net of tax | | | | (35,990 | ) | | | (7,183 | ) | | (28,718 | ) | | (73,855 | ) |
| | Gains (losses) on derivative financial instruments: | | | | | | | | | | |
| | Foreign exchange contracts | Net revenues | | | 1,774 |
| | | 4,948 |
| | 33,641 |
| | 28,798 |
|
| | Foreign exchange contracts | Cost of goods sold | | | (20,686 | ) | | | (13,286 | ) | | 610 |
| | 84,613 |
|
| | Foreign exchange contracts | Selling, general and administrative expenses | | | (4,772 | ) | | | (1,981 | ) | | (3,610 | ) | | (4,314 | ) |
| |
| | Foreign exchange contracts | Other income (expense), net | | | 355 |
| | | (2,427 | ) | | (1,851 | ) | | 2,864 |
|
| | Interest rate contracts | Interest expense | | | (5,012 | ) | | | (1,214 | ) | | (4,723 | ) | | (4,504 | ) |
| | Total before tax | | | | (28,341 | ) | | | (13,960 | ) | | 24,067 |
| | 107,457 |
|
| | Tax benefit (expense) | | | | 1,228 |
| | | 2,435 |
| | (3,344 | ) | | (35,092 | ) |
| | Net of tax | | | | (27,113 | ) | | | (11,525 | ) | | 20,723 |
| | 72,365 |
|
| | Total reclassifications for the period, net of tax | | | $ | (63,103 | ) | | | $ | (18,708 | ) | | $ | (7,995 | ) | | $ | (1,490 | ) |
F-40 VF Corporation Fiscal 2019 Form 10-K
VF CORPORATION
Notes to Consolidated Financial Statements
March 2019
NOTE 17 — STOCK-BASED COMPENSATION
Pursuant to the amended and restated 1996 Stock Compensation Plan approved by stockholders, VF is authorized to grant nonqualified stock options, restricted stock units (“RSUs”) and restricted stock to officers, key employees and nonemployee members of VF’s Board of Directors. Substantially all stock-based compensation awards are classified as equity awards, which are accounted for in stockholders’ equity in the Consolidated Balance Sheets. On a limited basis, cash-settled stock appreciation rights are granted to employees in certain international jurisdictions.
These awards are accounted for as liabilities in the Consolidated Balance Sheets and remeasured to fair value each reporting period until the awards are settled. Compensation cost for all awards expected to vest is recognized over the shorter of the requisite service period or the vesting period. Awards that do not vest are forfeited.
The amounts reported in these disclosures have not been segregated between continuing and discontinued operations.
Total stock-based compensation cost and the associated income tax benefits recognized in the Consolidated Statements of Income, and stock-based compensation costs included in inventory in the Consolidated Balance Sheets, are as follows:
|
| | | | | | | | | | | | | | | | | |
| | Year Ended March | | | Three Months Ended March (Transition Period) | | Year Ended December |
(In thousands) | | 2019 | | | 2018 | | 2017 | | 2016 |
Stock-based compensation cost | | $ | 105,157 |
| | | $ | 25,440 |
| | $ | 81,641 |
| | $ | 67,762 |
|
Income tax benefits | | 23,650 |
| | | 5,771 |
| | 26,697 |
| | 22,870 |
|
Stock-based compensation costs included in inventory at period end | | 3,165 |
| | | 2,236 |
| | 1,938 |
| | 1,332 |
|
At the end of March 2019, there was $56.0 million of total unrecognized compensation cost related to all stock-based compensation arrangements that will be recognized over a weighted average period of 1 year.
At the end of March 2019, there were 27,710,266 shares available for future grants of stock options and stock awards under the 1996
Stock Compensation Plan. Shares for option exercises are issued from VF’s authorized but unissued Common Stock. VF has a practice of repurchasing shares of Common Stock in the open market to offset, on a long-term basis, dilution caused by awards under equity compensation plans.
Stock options are granted with an exercise price equal to the fair market value of VF Common Stock on the date of grant. Employee stock options vest in equal annual installments over three years, and compensation cost is recognized ratably over the shorter of
the requisite service period or the vesting period. Stock options granted to nonemployee members of VF’s Board of Directors become exercisable one year from the date of grant. All options have ten-year terms.
The grant date fair value of each option award is calculated using a lattice option-pricing valuation model, which incorporates a range of assumptions for inputs as follows:
|
| | | | | | | | | |
| | Year Ended March | | | Three Months Ended March (Transition Period) | | Year Ended December |
| | 2019 | | | 2018 | | 2017 | | 2016 |
Expected volatility | | 22% to 29% | | | 24% to 29% | | 23% to 30% | | 21% to 29% |
Weighted average expected volatility | | 25% | | | 25% | | 24% | | 24% |
Expected term (in years) | | 6.1 to 7.5 | | | 6.1 to 7.6 | | 6.3 to 7.7 | | 6.3 to 7.6 |
Weighted average dividend yield | | 2.6% | | | 2.9% | | 2.8% | | 2.2% |
Risk-free interest rate | | 2.1% to 3.2% | | | 1.9% to 2.9% | | 0.7% to 2.4% | | 0.4% to 1.7% |
Weighted average fair value at date of grant | | $16.82 | | | $15.34 | | $9.90 | | $12.08 |
Expected volatility over the contractual term of an option was based on a combination of the implied volatility from publicly traded options on VF Common Stock and the historical volatility of VF Common Stock. The expected term represents the period of time over which vested options are expected to be outstanding before exercise. VF used historical data to estimate option exercise behaviors and to estimate the number of options that would vest.
Groups of employees that have historically exhibited similar option exercise behaviors were considered separately in estimating the expected term for each employee group. Dividend yield represents expected dividends on VF Common Stock for the contractual life of the options. Risk-free interest rates for the periods during the contractual life of the option were the implied yields at the date of grant from the U.S. Treasury zero coupon yield curve.
VF Corporation Fiscal 2019 Form 10-K F-41
VF CORPORATION
Notes to Consolidated Financial Statements
March 2019
Stock option activity for the three-month period ended March 2018 and the year ended March 2019 is summarized as follows:
|
| | | | | | | | | | | | |
| Number of Shares | | Weighted Average Exercise Price | | Weighted Average Remaining Contractual Term (Years) | | Aggregate Intrinsic Value (In thousands) |
Outstanding, December 2017 | 14,250,084 |
| | $ | 52.03 |
| | | | |
Granted | 1,843,749 |
| | 74.80 |
| | | | |
Exercised | (1,484,537 | ) | | 38.94 |
| | | | |
Forfeited/cancelled | (117,782 | ) | | 66.36 |
| | | | |
Outstanding, March 2018 | 14,491,514 |
| | 56.15 |
| | | | |
Granted | 101,197 |
| | 81.01 |
| | | | |
Exercised | (4,316,539 | ) | | 46.86 |
| | | | |
Forfeited/cancelled | (365,962 | ) | | 65.27 |
| | | | |
Outstanding, March 2019 | 9,910,210 |
| | $ | 60.11 |
| | 6.7 | | $ | 265,734 |
|
Exercisable, March 2019 | 7,781,198 |
| | $ | 58.60 |
| | 6.2 | | $ | 220,251 |
|
The total fair value of stock options that vested during the year ended March 2019, the three months ended March 2018 and the years ended December 2017 and 2016 was $26.8 million, $28.3 million, $28.0 million and $26.7 million, respectively. The total intrinsic value of stock options exercised during the year ended March 2019, the three months ended March 2018 and the years ended December 2017 and 2016 was $171.6 million, $57.3 million, $106.7 million and $86.6 million, respectively.
VF grants performance-based RSUs that enable employees to receive shares of VF Common Stock at the end of a three-year period. Each performance-based RSU has a potential final payout ranging from zero to two shares of VF Common Stock. For performance-based RSUs granted prior to February 2018, the number of shares earned by participants, if any, is based on achievement of a three-year baseline profitability goal and annually established performance goals set by the Talent and Compensation Committee of the Board of Directors. For performance-based RSUs granted in the three months ended March 2018 and Fiscal 2019, the number of shares earned by participants, if any, is based on achievement of three-year financial targets set by the Talent and Compensation Committee of the Board of Directors. For all performance-based RSUs, shares are issued to participants in the year following the conclusion of each three-year performance period.
The actual number of shares earned may also be adjusted upward or downward by 25% of the target award, based on how VF’s total shareholder return (“TSR”) over the three-year period compares to the TSR for companies included in the Standard & Poor’s 500 Consumer Discretionary Index for grants issued in the three months ended March 2018 and Fiscal 2019, and the Standard & Poor's 500 Index for grants issued in the years ended December 2017 and 2016. The grant date fair value of the TSR-based adjustment was determined using a Monte Carlo simulation technique that incorporates option-pricing model inputs, and was
$4.61, $4.61, $2.67 and $4.48 per share for the year ended March 2019, three-month period ended March 2018 and years ended December 2017 and 2016 performance-based RSU grants, respectively.
VF also grants nonperformance-based RSUs to certain key employees in international jurisdictions and to nonemployee members of the Board of Directors. Each nonperformance-based RSU entitles the holder to one share of VF Common Stock. The employee nonperformance-based RSUs generally vest over periods of up to four years from the date of grant. The nonperformance-based RSUs granted to nonemployee members of the Board of Directors vest upon grant and will be settled in shares of VF Common Stock one year from the date of grant.
In addition, VF began making nonperformance-based RSU grants to employees as part of its annual stock compensation program beginning in the three months ended March 2018. Each nonperformance-based RSU entitles the holder to one share of VF Common Stock. These awards generally vest 50% over a two-year period and 50% over a four-year period from the date of grant.
Dividend equivalents on the RSUs accrue without compounding and are payable in additional shares of VF Common Stock when the RSUs vest. Dividend equivalents are subject to the same risk of forfeiture as the RSUs.
F-42 VF Corporation Fiscal 2019 Form 10-K
VF CORPORATION
Notes to Consolidated Financial Statements
March 2019
RSU activity for the three-month period ended March 2018 and the year ended March 2019 is summarized as follows:
|
| | | | | | | | | | | | | |
| Performance-based | | Nonperformance-based |
| Number Outstanding | | Weighted Average Grant Date Fair Value | | Number Outstanding | | Weighted Average Grant Date Fair Value |
Outstanding, December 2017 | 1,504,551 |
| | $ | 62.22 |
| | 335,093 |
| | $ | 60.72 |
|
Granted | 351,490 |
| | 74.80 |
| | 407,074 |
| | 74.80 |
|
Issued as Common Stock | (405,871 | ) | | 75.33 |
| | (34,964 | ) | | 56.11 |
|
Forfeited/cancelled | (12,154 | ) | | 63.64 |
| | (10,780 | ) | | 72.45 |
|
Outstanding, March 2018 | 1,438,016 |
| | 61.58 |
| | 696,423 |
| | 69.00 |
|
Granted | 19,099 |
| | 80.39 |
| | 82,799 |
| | 79.21 |
|
Issued as Common Stock | — |
| | — |
| | (58,165 | ) | | 69.08 |
|
Forfeited/cancelled | (60,439 | ) | | 65.20 |
| | (56,224 | ) | | 73.54 |
|
Outstanding, March 2019 | 1,396,676 |
| | $ | 61.68 |
| | 664,833 |
| | $ | 69.88 |
|
Vested, March 2019 | 859,332 |
| | $ | 61.37 |
| | 69,139 |
| | $ | 74.80 |
|
The weighted average fair value of performance-based RSUs granted during the year ended March 2019, the three months ended March 2018 and the years ended December 2017 and 2016 was $80.39, $74.80, $53.69 and $61.31 per share, respectively, which was equal to the fair market value of the underlying VF Common Stock on each grant date. The total market value of awards outstanding at the end of March 2019 was $121.4 million. Awards earned and vested for the three-year performance period ended in December 2017 and distributed in early 2018 totaled 450,175 shares of VF Common Stock having a value of $36.4 million. Similarly, 480,555 shares of VF Common Stock having a value of $24.3 million were earned for the performance period ended in December 2016.
The weighted average fair value of nonperformance-based RSUs granted during the year ended March 2019, the three months ended March 2018 and the years ended December 2017 and 2016 was $79.21, $74.80, $57.49 and $61.83 per share, respectively, which was equal to the fair market value of the underlying VF Common Stock on each grant date. The total market value of awards outstanding at the end of March 2019 was $57.8 million.
VF grants restricted shares of VF Common Stock to certain members of management. The fair value of the restricted shares, equal to the fair market value of VF Common Stock at the grant date, is recognized ratably over the vesting period. Restricted
shares vest over periods of up to five years from the date of grant. Dividends accumulate in the form of additional restricted shares and are subject to the same risk of forfeiture as the restricted stock.
Restricted stock activity for the three-month period ended March 2018 and the year ended March 2019 is summarized below:
|
| | | | | | |
| Nonvested Shares Outstanding | | Weighted Average Grant Date Fair Value |
Nonvested shares, December 2017 | 684,963 |
| | $ | 57.01 |
|
Granted | 56,331 |
| | 74.70 |
|
Dividend equivalents | 4,188 |
| | 74.40 |
|
Vested | (53,203 | ) | | 57.90 |
|
Forfeited | (11,068 | ) | | 68.25 |
|
Nonvested shares, March 2018 | 681,211 |
| | 58.33 |
|
Granted | 79,188 |
| | 79.99 |
|
Dividend equivalents | 15,468 |
| | 82.02 |
|
Vested | (99,682 | ) | | 67.41 |
|
Forfeited | (49,460 | ) | | 62.76 |
|
Nonvested shares, March 2019 | 626,725 |
| | $ | 59.86 |
|
VF Corporation Fiscal 2019 Form 10-K F-43
VF CORPORATION
Notes to Consolidated Financial Statements
March 2019
Nonvested shares of restricted stock had a market value of $54.5 million at the end of March 2019. The market value of the shares that vested during the year ended March 2019, the three months ended March 2018 and the years ended December 2017 and 2016 was $8.7 million, $3.9 million, $19.4 million and $3.9 million, respectively.
NOTE 18 — INCOME TAXES
The provision for income taxes was computed based on the following amounts of income from continuing operations before income taxes:
|
| | | | | | | | | | | | | | | | | |
| | Year Ended March | | | Three Months Ended March (Transition Period) | | Year Ended December |
(In thousands) | | 2019 | | | 2018 | | 2017 | | 2016 |
Domestic | | $ | 337,066 |
| | | $ | 4,163 |
| | $ | 364,846 |
| | $ | 301,760 |
|
Foreign | | 1,190,338 |
| | | 289,970 |
| | 1,051,649 |
| | 982,956 |
|
Income before income taxes | | $ | 1,527,404 |
| | | $ | 294,133 |
| | $ | 1,416,495 |
| | $ | 1,284,716 |
|
The provision for income taxes consisted of:
|
| | | | | | | | | | | | | | | | | |
| | Year Ended March | | | Three Months Ended March (Transition Period) | | Year Ended December |
(In thousands) | | 2019 | | | 2018 | | 2017 | | 2016 |
Current: | | | | | | | | | |
Federal | | $ | 143,872 |
| | | $ | (4,864 | ) | | $ | 618,611 |
| | $ | 115,570 |
|
Foreign | | 164,974 |
| | | 36,634 |
| | 135,007 |
| | 123,960 |
|
State | | 22,455 |
| | | 896 |
| | 21,506 |
| | 37,957 |
|
| | 331,301 |
| | | 32,666 |
| | 775,124 |
| | 277,487 |
|
Deferred: | | | | | | | | | |
Federal and state | | (53,715 | ) | | | (13,656 | ) | | (76,039 | ) | | (63,610 | ) |
Foreign | | (9,186 | ) | | | 13,959 |
| | (3,799 | ) | | (8,015 | ) |
| | (62,901 | ) | | | 303 |
| | (79,838 | ) | | (71,625 | ) |
Income taxes | | $ | 268,400 |
| | | $ | 32,969 |
| | $ | 695,286 |
| | $ | 205,862 |
|
On December 22, 2017, the U.S. government enacted comprehensive tax legislation commonly referred to as the Tax Act. The Tax Act included a broad range of complex provisions impacting the taxation of multi-national companies. Generally, accounting for the impacts of newly enacted tax legislation is required to be completed in the period of enactment, however in response to the complexities and ambiguity surrounding the Tax Act, the SEC released SAB 118 to provide companies with relief around the initial accounting for the Tax Act. Pursuant to SAB 118, the SEC provided a one-year measurement period for companies to analyze and finalize accounting for the Tax Act. During the one-year measurement period, SAB 118 allowed companies to recognize provisional amounts when reasonable estimates could be made for the impacts resulting from the Tax Act.
VF finalized its accounting for the Tax Act during the one-year measurement period under SAB 118, and recognized additional net charges of $18.2 million, primarily comprised of $14.3 million tax expense related to the transition tax, additional tax benefits of $0.3 million related to revaluing U.S. deferred tax assets and liabilities using the new U.S. corporate tax rate of 21%, and $4.2 million tax expense related to establishing a deferred tax liability for foreign withholding taxes, resulting in a cumulative net charge of $483.7 million. The measurement period adjustments include $5.1 million of net tax benefit recognized in the three months ended March 2018
and $23.3 million of net tax expense recognized during the year ended March 2019.
On January 15, 2019 final regulations under Section 965 related to the transition tax were released. After analyzing these regulations, the Company recorded an additional net charge of $13.9 million, primarily comprised of $20.7 million tax expense related to transition tax and a net tax benefit of $6.8 million related to a reduction in unrecognized tax benefits as a result of the final regulations.
The income tax payable attributable to the transition tax is due over an 8-year period beginning in 2018. At March 30, 2019, a noncurrent income tax payable of approximately $416.1 million attributable to the transition tax is reflected in the other liabilities line item of the Consolidated Balance Sheet.
The Tax Act created a new tax on certain GILTI from foreign operations. Under GAAP, companies may make an accounting policy election to either treat taxes resulting from GILTI as a current-period expense when they are incurred or factor such amounts into the measurement of deferred taxes. The Company completed its analysis of the effects of the GILTI provisions and determined it will treat the taxes resulting from GILTI as a current-period expense, which is consistent with the treatment prior to the accounting policy election.
F-44 VF Corporation Fiscal 2019 Form 10-K
VF CORPORATION
Notes to Consolidated Financial Statements
March 2019
The differences between income taxes computed by applying the statutory federal income tax rate and income tax expense reported in the consolidated financial statements are as follows:
|
| | | | | | | | | | | | | | | | | |
| | Year Ended March | | | Three Months Ended March (Transition Period) | | Year Ended December |
(In thousands) | | 2019 | | | 2018 | | 2017 | | 2016 |
Tax at federal statutory rate | | $ | 320,755 |
| | | $ | 61,768 |
| | $ | 495,772 |
| | $ | 449,650 |
|
State income taxes, net of federal tax benefit | | 32,954 |
| | | (4,745 | ) | | 23,684 |
| | 24,426 |
|
Foreign rate differences | | (84,702 | ) | | | (9,227 | ) | | (217,131 | ) | | (262,392 | ) |
Tax reform | | 37,262 |
| | | (5,107 | ) | | 465,501 |
| | — |
|
Capital losses | | — |
| | | — |
| | (67,032 | ) | | — |
|
Valuation allowances (federal) | | — |
| | | 977 |
| | 37,296 |
| | — |
|
Stock compensation (federal) | | (26,398 | ) | | | (10,060 | ) | | (22,826 | ) | | (25,135 | ) |
Other | | (11,471 | ) | | | (637 | ) | | (19,978 | ) | | 19,313 |
|
Income taxes | | $ | 268,400 |
| | | $ | 32,969 |
| | $ | 695,286 |
| | $ | 205,862 |
|
Income tax expense includes tax benefits of $6.3 million, $9.8 million, $10.1 million and $19.4 million in the year ended March 2019, the three months ended March 2018 and the years ended December 2017 and 2016, respectively, from favorable audit outcomes on certain tax matters and from expiration of statutes of limitations.
On January 4, 2016, VF sold certain intellectual property rights among various subsidiaries, which more closely aligns the intellectual property rights for certain foreign operations with the respective business activities of those operations, consistent with how the intellectual property is used and developed within the business. The sale of these intellectual property rights was classified as an intra-entity transaction under GAAP, and as such, the corresponding gain was eliminated from the 2016 consolidated financial statements, and the tax impact of the gain was established at the transaction date as a deferred charge of $291.1 million within the other assets line item on the 2016 Consolidated Balance Sheet. In October 2016, the FASB issued an update to their accounting guidance on the recognition of current and deferred income taxes for intra-entity asset transfers. The new guidance requires an entity to recognize the income tax consequences of an intra-entity transfer of an asset other than inventory when the transfer occurs. The Company early adopted this guidance in the first quarter of 2017 using the modified retrospective method, which requires a cumulative adjustment to retained earnings as of the beginning of the period of adoption. The cumulative adjustment to the January 1, 2017 Consolidated Balance Sheet was a reduction in both the other assets and retained earnings line items of $237.8 million.
VF was granted a ruling which lowered the effective income tax rate on taxable earnings for years 2010 through 2014 under Belgium’s excess profit tax regime. In February 2015, the European Union Commission (“EU”) opened a state aid investigation into Belgium’s rulings. On January 11, 2016, the EU announced its
decision that these rulings were illegal and ordered that tax benefits granted under these rulings should be collected from the affected companies, including VF.
On March 22, 2016, the Belgium government filed an appeal seeking annulment of the EU decision. Additionally, on June 21, 2016, VF Europe BVBA filed its own application for annulment of the EU decision.
On December 22, 2016, Belgium adopted a law which entitled the Belgium tax authorities to issue tax assessments, and demand timely payments from companies which benefited from the excess profits regime. On January 10, 2017, VF Europe BVBA received an assessment for €31.9 million tax and interest related to excess profits benefits received in prior years. VF Europe BVBA remitted €31.9 million ($33.9 million) on January 13, 2017, which was recorded as an income tax receivable in 2017 based on the expected success of the aforementioned requests for annulment. An additional assessment of €3.1 million ($3.8 million) was received and paid in January 2018. On February 14, 2019 the General Court annulled the EU decision and on April 26, 2019 the EU appealed the General Court's annulment. Both listed requests for annulment remain open and unresolved. If this matter is adversely resolved, these amounts will not be collected by VF.
In addition, VF has been granted a lower effective income tax rate on taxable earnings in another foreign jurisdiction for the years 2010 through 2019. This lower rate, when compared with the country’s statutory rate, resulted in income tax reductions of $15.7 million ($0.04 per diluted share) in the year ended March 2019, $7.5 million ($0.02 per diluted share) in the three months ended March 2018, $17.8 million ($0.04 per diluted share) in the year ended December 2017 and $12.0 million ($0.03 per diluted share) in the year ended December 2016.
VF Corporation Fiscal 2019 Form 10-K F-45
VF CORPORATION
Notes to Consolidated Financial Statements
March 2019
Deferred income tax assets and liabilities consisted of the following:
|
| | | | | | | | | | | | | |
(In thousands) | | March 2019 | | | March 2018 | | December 2017 |
Deferred income tax assets: | | | | | | | |
Inventories | | $ | 32,647 |
| | | $ | 24,797 |
| | $ | 21,146 |
|
Deferred compensation | | 51,913 |
| | | 53,843 |
| | 55,326 |
|
Other employee benefits | | 69,594 |
| | | 52,456 |
| | 45,464 |
|
Stock compensation | | 37,317 |
| | | 38,244 |
| | 45,960 |
|
Other accrued expenses | | 127,684 |
| | | 155,635 |
| | 158,632 |
|
Capital loss carryforwards | | 19,423 |
| | | 46,069 |
| | 34,705 |
|
Operating loss carryforwards | | 229,955 |
| | | 252,695 |
| | 251,236 |
|
Gross deferred income tax assets | | 568,533 |
| | | 623,739 |
| | 612,469 |
|
Valuation allowances | | (188,258 | ) | | | (226,269 | ) | | (225,141 | ) |
Net deferred income tax assets | | 380,275 |
| | | 397,470 |
| | 387,328 |
|
Deferred income tax liabilities: | | | | | | | |
Depreciation | | 25,355 |
| | | 27,023 |
| | 25,272 |
|
Intangible assets | | 222,769 |
| | | 223,435 |
| | 237,667 |
|
Other deferred tax liabilities | | 91,464 |
| | | 82,406 |
| | 78,824 |
|
Deferred income tax liabilities | | 339,588 |
| | | 332,864 |
| | 341,763 |
|
Net deferred income tax assets (liabilities) | | $ | 40,687 |
| | | $ | 64,606 |
| | $ | 45,565 |
|
Amounts included in the Consolidated Balance Sheets: | | | | | | | |
Other assets (Note 10) | | $ | 109,551 |
| | | $ | 105,493 |
| | $ | 103,601 |
|
Other liabilities (Note 14) | | (68,864 | ) | | | (40,887 | ) | | (58,036 | ) |
| | $ | 40,687 |
| | | $ | 64,606 |
| | $ | 45,565 |
|
At the end of Fiscal 2019, the Company is not asserting indefinite reinvestment with regards to short-term liquid assets of certain foreign subsidiaries. All other foreign earnings, including basis differences of certain foreign subsidiaries, continue to be considered indefinitely reinvested. The Company has not determined the deferred tax liability associated with these undistributed earnings and basis differences, as such determination is not practicable.
VF has potential tax benefits totaling $199.3 million for foreign operating loss carryforwards, of which $171.3 million have an unlimited carryforward life. In addition, there are $0.1 million of potential tax benefits for federal operating loss carryforwards that expire in 2020, $19.4 million of potential tax benefits for federal and state capital loss carryforwards that begin to expire in 2022 and $30.5 million of potential tax benefits for state operating loss and credit carryforwards that expire between 2020 and 2039.
A valuation allowance has been provided where it is more likely than not that the deferred tax assets related to those operating loss carryforwards will not be realized. Valuation allowances totaled $150.5 million for available foreign operating loss carryforwards, $5.1 million for available capital loss carryforwards, $22.7 million for available state operating loss and credit carryforwards, and $10.0 million for other foreign deferred income tax assets. During Fiscal 2019, VF had a net decrease in valuation allowances of $25.5 million related to capital loss carryforwards,a net increase of $1.7 million related to state operating loss and credit carryforwards and a decrease of $17.1 million related to foreign operating loss carryforwards and other foreign deferred tax assets, inclusive of foreign currency effects.
F-46 VF Corporation Fiscal 2019 Form 10-K
VF CORPORATION
Notes to Consolidated Financial Statements
March 2019
A reconciliation of the change in the accrual for unrecognized income tax benefits is as follows:
|
| | | | | | | | | | | | |
(In thousands) | Unrecognized
Income Tax
Benefits | | Accrued
Interest
and Penalties | | Unrecognized
Income Tax
Benefits
Including Interest
and Penalties | |
Balance, December 2015 | $ | 75,677 |
| | $ | 9,369 |
| | $ | 85,046 |
| |
Additions for current year tax positions | 121,025 |
| | — |
| | 121,025 |
| |
Additions for prior year tax positions | 6,164 |
| | 2,880 |
| | 9,044 |
| |
Reductions for prior year tax positions | (4,798 | ) | | (1,362 | ) | | (6,160 | ) | |
Reductions due to statute expirations | (14,985 | ) | | (1,335 | ) | | (16,320 | ) | |
Payments in settlement | (6,108 | ) | | (829 | ) | | (6,937 | ) | |
Currency translation | (9 | ) | | (14 | ) | | (23 | ) | |
Balance, December 2016 | 176,966 |
| | 8,709 |
| | 185,675 |
| |
Additions for current year tax positions | 28,049 |
| | — |
| | 28,049 |
| |
Additions for prior year tax positions | 22,968 |
| | 6,808 |
| | 29,776 |
| |
Reductions for prior year tax positions | (22,163 | ) | | (279 | ) | | (22,442 | ) | |
Reductions due to statute expirations | (9,028 | ) | | (915 | ) | | (9,943 | ) | |
Payments in settlement | (855 | ) | | (248 | ) | | (1,103 | ) | |
Currency translation | 55 |
| | 11 |
| | 66 |
| |
Balance, December 2017 | 195,992 |
| | 14,086 |
| | 210,078 |
| |
Additions for current year tax positions | 2,012 |
| | — |
| | 2,012 |
| |
Additions for prior year tax positions | 477 |
| | 2,340 |
| | 2,817 |
| |
Reductions for prior year tax positions | (201 | ) | | (3 | ) | | (204 | ) | |
Reductions due to statute expirations | (9,222 | ) | | (985 | ) | | (10,207 | ) | |
Payments in settlement | — |
| | — |
| | — |
| |
Currency translation | 17 |
| | 2 |
| | 19 |
| |
Balance, March 2018 | 189,075 |
| | 15,440 |
| | 204,515 |
| |
Additions for current year tax positions | 8,511 |
| | — |
| | 8,511 |
| |
Additions for prior year tax positions | 16,211 |
| | 12,521 |
| | 28,732 |
| |
Reductions for prior year tax positions | (18,753 | ) | | (467 | ) | | (19,220 | ) | |
Reductions due to statute expirations | (30 | ) | | (7 | ) | | (37 | ) | |
Payments in settlement | (6,754 | ) | | (919 | ) | | (7,673 | ) | |
Currency translation | (35 | ) | | (3 | ) | | (38 | ) | |
Balance, March 2019 | $ | 188,225 |
| | $ | 26,565 |
| | $ | 214,790 |
| |
|
| | | | | | | | | | | | | |
(In thousands) | | March 2019 | | | March 2018 | | December 2017 |
Amounts included in the Consolidated Balance Sheets: | | | | | | | |
Unrecognized income tax benefits, including interest and penalties | | $ | 214,790 |
| | | $ | 204,515 |
| | $ | 210,078 |
|
Less deferred tax benefits | | 40,862 |
| | | 35,474 |
| | 31,197 |
|
Total unrecognized tax benefits | | $ | 173,928 |
| | | $ | 169,041 |
| | $ | 178,881 |
|
The unrecognized tax benefits of $173.9 million at the end of Fiscal 2019, if recognized, would reduce the annual effective tax rate.
VF files a consolidated U.S. federal income tax return, as well as separate and combined income tax returns in numerous state and international jurisdictions. In the U.S., the IRS examinations for tax
years through 2014 have been effectively settled. The examination of Timberland’s 2011 tax return is ongoing.
In addition, VF is currently subject to examination by various state and international tax authorities. Management regularly assesses the potential outcomes of both ongoing and future examinations for the current and prior years and has concluded that VF’s
VF Corporation Fiscal 2019 Form 10-K F-47
VF CORPORATION
Notes to Consolidated Financial Statements
March 2019
provision for income taxes is adequate. The outcome of any one examination is not expected to have a material impact on VF’s consolidated financial statements. Management believes that some of these audits and negotiations will conclude during the next 12 months. Management also believes that it is reasonably possible
that the amount of unrecognized income tax benefits may decrease by $28.5 million within the next 12 months due to settlement of audits and expiration of statutes of limitations, $27.1 million of which would reduce income tax expense.
NOTE 19 — REPORTABLE SEGMENT INFORMATION
In light of recently completed portfolio management actions and organizational realignments, the Company realigned its internal reporting structure in the year ended March 2019 to reflect the organizational changes to better support and assess the operations of the business. The chief operating decision maker allocates resources and assesses performance based on a global brand view which represents VF's operating segments. The
operating segments have been evaluated and combined into reportable segments because they have met the similar economic characteristics and qualitative aggregation criteria set forth in the relevant accounting guidance. Based on this assessment, the Company's reportable segments have been identified as: Outdoor, Active, Work and Jeans.
Below is a description of VF's reportable segments and the primary brands included within each:
|
| | |
REPORTABLE SEGMENT | | PRIMARY BRANDS |
Outdoor - Outdoor apparel, footwear and equipment | | The North Face® |
| | Timberland® (excluding Timberland PRO®) |
| | Icebreaker® |
| | Smartwool® |
| | Altra® |
| | |
Active - Active apparel, footwear and accessories | | Vans® |
| | Kipling® |
| | Napapijri® |
| | Eastpak® |
| | JanSport® |
| | Reef® |
| | Eagle Creek® |
| | |
Work - Work and work-inspired lifestyle apparel, footwear and occupational apparel | | Dickies® |
| | Red Kap® |
| | Bulwark® |
| | Timberland PRO® |
| | VF Solutions® |
| | Wrangler® RIGGS |
| | Walls® |
| | Terra® |
| | Workrite® |
| | Kodiak® |
| | Horace Small® |
| | |
Jeans - Denim and casual apparel | | Wrangler® (excluding Wrangler® RIGGS) |
| | Lee® |
| | Lee® Riders® |
| | Rock and Republic® |
Other - included in the tables below for purposes of reconciliation of revenues and profit, but it is not considered a reportable segment. Includes sales of non-VF products at VF Outlet™ stores and results from transition services related to the sales of the Nautica® and Reef® brand businesses.
F-48 VF Corporation Fiscal 2019 Form 10-K
VF CORPORATION
Notes to Consolidated Financial Statements
March 2019
In the tables below, the Company has recast historical financial information to reflect the new reportable segments. The recast historical information has no impact on the Company's previously reported consolidated financial statements.
The results of Williamson-Dickie have been included in the Work segment since the October 2, 2017 acquisition date. The results of Kipling North America, which were previously included in the former Sportswear segment, have been included in the Active segment for all periods presented. The results of Icebreaker and Altra have been included in the Outdoor segment since their acquisition dates of April 3, 2018 and June 1, 2018, respectively.
The results of the Van Moer business have been included in the Work segment through the October 5, 2018 date of sale. The results of the Reef® brand business have been included in the Active segment through the October 26, 2018 date of sale.
The primary financial measures used by management to evaluate the financial results of VF's reportable segments are segment revenues and segment profit. Segment profit comprises the operating income and other income (expense), net line items of each segment.
Accounting policies used for internal management reporting at the individual segments are consistent with those in Note 1, except as stated below. Corporate costs (other than common costs allocated to the segments), impairment charges and net interest expense are not controlled by segment management and therefore are
excluded from the measurement of segment profit. Common costs such as information systems processing, retirement benefits and insurance are allocated from corporate costs to the segments based on appropriate metrics such as usage or employment. Corporate costs that are not allocated to the segments consist of corporate headquarters expenses (including compensation and benefits of corporate management and staff, certain legal and professional fees and administrative and general costs) and other expenses which include a portion of defined benefit pension costs, development costs for management information systems, costs of registering, maintaining and enforcing certain of VF’s trademarks and miscellaneous consolidated costs. Defined benefit pension plans in the U.S. are centrally managed. The current year service cost component of pension cost is allocated to the segments, while the remaining pension cost components are reported in corporate and other expenses.
Segment assets, for internal management purposes, are those used directly in or resulting from the operations of each business, which are accounts receivable and inventories. Segment assets included in the Other category represent balances related to the VF Outlet™ business, transition services and other corporate activities, and are provided for purposes of reconciliation as the Other category is not considered a reportable segment. Total expenditures for additions to long-lived assets are not disclosed as this information is not regularly provided to the chief operating decision maker at the segment level.
VF Corporation Fiscal 2019 Form 10-K F-49
VF CORPORATION
Notes to Consolidated Financial Statements
March 2019
Financial information for VF’s reportable segments is as follows: |
| | | | | | | | | | | | | | | | | |
| | Year Ended March | | | Three Months Ended March (Transition Period) | | Year Ended December |
(In thousands) | | 2019 | | | 2018 | | 2017 | | 2016 |
Segment revenues: | | | | | | | | | |
Outdoor | | $ | 4,649,024 |
| | | $ | 888,039 |
| | $ | 4,208,958 |
| | $ | 4,123,372 |
|
Active | | 4,721,792 |
| | | 1,071,598 |
| | 3,791,737 |
| | 3,318,428 |
|
Work | | 1,862,017 |
| | | 442,258 |
| | 1,099,714 |
| | 776,214 |
|
Jeans | | 2,491,769 |
| | | 623,266 |
| | 2,597,623 |
| | 2,690,059 |
|
Other | | 124,058 |
| | | 20,285 |
| | 113,145 |
| | 118,074 |
|
Total segment revenues | | $ | 13,848,660 |
| | | $ | 3,045,446 |
| | $ | 11,811,177 |
| | $ | 11,026,147 |
|
Segment profit: | | | | | | | | | |
Outdoor | | $ | 544,425 |
| | | $ | 44,673 |
| | $ | 537,543 |
| | $ | 594,485 |
|
Active | | 1,125,709 |
| | | 237,620 |
| | 805,843 |
| | 628,163 |
|
Work | | 220,670 |
| | | 40,024 |
| | 163,585 |
| | 137,301 |
|
Jeans | | 300,502 |
| | | 103,805 |
| | 406,524 |
| | 479,179 |
|
Other | | 457 |
| | | (3,074 | ) | | (3,090 | ) | | (4,809 | ) |
Total segment profit | | 2,191,763 |
| | | 423,048 |
| | 1,910,405 |
| | 1,834,319 |
|
Impairment of goodwill and intangible assets (a) | | — |
| | | — |
| | — |
| | (79,644 | ) |
Corporate and other expenses (b) (c) | | (578,934 | ) | | | (107,750 | ) | | (408,030 | ) | | (384,413 | ) |
Interest expense, net | | (85,425 | ) | | | (21,165 | ) | | (85,880 | ) | | (85,546 | ) |
Income from continuing operations before income taxes | | $ | 1,527,404 |
| | | $ | 294,133 |
| | $ | 1,416,495 |
| | $ | 1,284,716 |
|
| |
(a) | Represents goodwill and intangible asset impairment charges in 2016 related to the Outdoor segment (lucy® brand discussed in Notes 8, 9 and 22). The impairment charges were excluded from the profit of the Outdoor segment since they are not part of the ongoing operations of the business. |
| |
(b) | Reflects a $50.9 million pension settlement charge in 2016 (Note 15). |
| |
(c) | Certain corporate overhead and other costs of, $16.6 million and $44.3 million during the years ended December 2017 and 2016, respectively, previously allocated to the former Sportswear, Imagewear, Outdoor & Action Sports and Contemporary Brands segments for segment reporting purposes, have been reallocated to continuing operations as discussed in Note 4. |
|
| | | | | | | | | | | | | |
| | March | | | March | | December |
(In thousands) | | 2019 | | | 2018 | | 2017 |
Segment assets: | | | | | | | |
Outdoor | | $ | 1,108,274 |
| | | $ | 924,870 |
| | $ | 1,082,264 |
|
Active | | 981,033 |
| | | 873,737 |
| | 686,991 |
|
Work | | 742,329 |
| | | 669,641 |
| | 657,025 |
|
Jeans | | 720,620 |
| | | 710,481 |
| | 629,648 |
|
Other | | 99,570 |
| | | 91,299 |
| | 80,667 |
|
Total segment assets | | 3,651,826 |
| | | 3,270,028 |
| | 3,136,595 |
|
Cash and equivalents | | 543,011 |
| | | 680,762 |
| | 563,483 |
|
Property, plant and equipment, net | | 1,057,268 |
| | | 1,011,617 |
| | 1,014,638 |
|
Intangible assets and goodwill | | 3,779,161 |
| | | 3,813,329 |
| | 3,782,425 |
|
Other assets | | 1,325,519 |
| | | 1,161,994 |
| | 1,080,661 |
|
Assets of discontinued operations | | — |
| | | 373,580 |
| | 380,700 |
|
Consolidated assets | | $ | 10,356,785 |
| | | $ | 10,311,310 |
| | $ | 9,958,502 |
|
F-50 VF Corporation Fiscal 2019 Form 10-K
VF CORPORATION
Notes to Consolidated Financial Statements
March 2019
|
| | | | | | | | | | | | | | | | | |
| | Year Ended March | | | Three Months Ended March (Transition Period) | | Year Ended December |
(In thousands) | | 2019 | | | 2018 | | 2017 | | 2016 |
Depreciation and amortization expense: (a) | | | | | | | | | |
Outdoor | | $ | 82,259 |
| | | $ | 16,998 |
| | $ | 86,838 |
| | $ | 83,070 |
|
Active | | 73,395 |
| | | 18,953 |
| | 70,219 |
| | 66,031 |
|
Work | | 34,446 |
| | | 10,149 |
| | 12,926 |
| | 5,051 |
|
Jeans | | 38,505 |
| | | 8,710 |
| | 35,586 |
| | 39,237 |
|
Other | | 2,542 |
| | | 609 |
| | 3,560 |
| | 3,537 |
|
Corporate | | 69,858 |
| | | 15,501 |
| | 68,016 |
| | 57,290 |
|
| | $ | 301,005 |
| | | $ | 70,920 |
| | $ | 277,145 |
| | $ | 254,216 |
|
| |
(a) | Excludes $0.6 million, $14.0 million and $27.4 million of depreciation and amortization related to discontinued operations in the three months ended March 2018 and the years ended December 2017 and 2016, respectively. These amounts are included in depreciation and amortization in our Consolidated Statements of Cash Flows as we did not segregate cash flows related to discontinued operations (Note 4). |
Supplemental information (with revenues by geographic area based on the origin of the shipment) is as follows:
|
| | | | | | | | | | | | | | | | | |
| | Year Ended March | | | Three Months Ended March (Transition Period) | | Year Ended December |
(In thousands) | | 2019 | | | 2018 | | 2017 | | 2016 |
Total revenues: | | | | | | | | | |
U.S. | | $ | 8,126,280 |
| | | $ | 1,643,991 |
| | $ | 6,923,749 |
| | $ | 6,669,026 |
|
Foreign, primarily Europe | | 5,722,380 |
| | | 1,401,455 |
| | 4,887,428 |
| | 4,357,121 |
|
| | $ | 13,848,660 |
| | | $ | 3,045,446 |
| | $ | 11,811,177 |
| | $ | 11,026,147 |
|
Property, plant and equipment: | | | | | | | | | |
U.S. | | $ | 644,839 |
| | | $ | 605,487 |
| | $ | 607,437 |
| | |
Foreign, primarily Europe | | 412,429 |
| | | 406,130 |
| | 407,201 |
| | |
| | $ | 1,057,268 |
| | | $ | 1,011,617 |
| | $ | 1,014,638 |
| |
|
|
No single customer accounted for 10% or more of the Company’s total revenues in the year ended March 2019, the three months ended March 2018 and the years ended December 2017 and 2016.
NOTE 20 — COMMITMENTS AND CONTINGENCIES
VF is obligated under noncancelable operating leases related primarily to retail stores, office space, distribution facilities and equipment. Rent expense, net of sublease income that was not significant in any period, was included in the Consolidated Statements of Income as follows:
|
| | | | | | | | | | | | | | | | | |
| | Year Ended March | | | Three Months Ended March (Transition Period) | | Year Ended December |
(In thousands) | | 2019 | | | 2018 | | 2017 | | 2016 |
Minimum rent expense | | $ | 386,544 |
| | | $ | 104,235 |
| | $ | 355,217 |
| | $ | 337,879 |
|
Contingent rent expense | | 34,267 |
| | | 6,791 |
| | 24,410 |
| | 18,062 |
|
Rent expense | | $ | 420,811 |
| | | $ | 111,026 |
| | $ | 379,627 |
| | $ | 355,941 |
|
Future minimum lease payments during the noncancelable lease term are $366.4 million, $314.8 million, $228.9 million, $163.5 million and $106.9 million for fiscal years 2020 through 2024, respectively, and $252.8 million thereafter.
VF has entered into licensing agreements that provide VF rights to market products under trademarks owned by other parties. Royalties under these agreements are recognized in cost of goods
sold in the Consolidated Statements of Income. Certain of these agreements contain minimum royalty and minimum advertising requirements. Future minimum royalty payments, including any required advertising payments, are $25.6 million, $13.1 million, $8.3 million, $3.1 million and $1.8 million for fiscal years 2020 through 2024, respectively, and $8.8 million thereafter.
VF Corporation Fiscal 2019 Form 10-K F-51
VF CORPORATION
Notes to Consolidated Financial Statements
March 2019
In the ordinary course of business, VF has entered into purchase commitments for raw materials, contract production and finished products. Total payments required under these agreements are$2.6 billion, $17.8 million, $6.8 million, and $7.0 million for fiscal years 2020 through 2023, respectively and no commitments thereafter.
VF has entered into commitments for (i) service and maintenance agreements related to its management information systems, (ii) capital spending, and (iii) advertising. Future payments under these agreements are $108.0 million, $18.8 million, $16.3 million, $11.7 million and $7.4 million for fiscal years 2020 through 2024, respectively, and $12.1 million thereafter.
Surety bonds, customs bonds, standby letters of credit and international bank guarantees, all of which represent contingent guarantees of performance under self-insurance and other programs, totaled $116.2 million as of March 2019. These commitments would only be drawn upon if VF were to fail to meet its claims or other obligations.
Contingencies
The Company petitioned the U.S. Tax Court to resolve an IRS dispute regarding the timing of income inclusion associated with the 2011
Timberland acquisition. The Company remains confident in our timing and treatment of the income inclusion, and therefore this matter is not reflected in our financial statements. We are vigorously defending our position, and do not expect the resolution to have a material adverse impact on the Company's financial position, results of operations or cash flows. While the IRS argues immediate income inclusion, the Company's position is to include the income over a period of years. As the matter relates to 2011, nearly half of the timing at dispute has passed with the Company including the income, and paying the related tax, on our income tax returns. The Company notes that should the IRS prevail in this timing matter, the net interest expense would be up to $130 million. Further, this timing matter is impacted by the Tax Act that reduced the U.S. corporate income tax rate from 35% to 21%. If the IRS is successful, this rate differential would increase tax expense by approximately $136 million.
The Company is currently involved in other legal proceedings that are ordinary, routine litigation incidental to the business. The resolution of any particular proceeding is not currently expected to have a material adverse impact on the Company's financial position, results of operations or cash flows.
NOTE 21 — EARNINGS PER SHARE
|
| | | | | | | | | | | | | | | | | |
| | Year Ended March | | | Three Months Ended March (Transition Period) | | Year Ended December |
(In thousands, except per share amounts) | | 2019 | | | 2018 | | 2017 | | 2016 |
Earnings per share — basic: | | | | | | | | | |
Income from continuing operations | | $ | 1,259,004 |
| | | $ | 261,164 |
| | $ | 721,209 |
| | $ | 1,078,854 |
|
Weighted average common shares outstanding | | 395,189 |
| | | 395,253 |
| | 399,223 |
| | 416,103 |
|
Earnings per share from continuing operations | | $ | 3.19 |
| | | $ | 0.66 |
| | $ | 1.81 |
| | $ | 2.59 |
|
Earnings per share — diluted: | |
| | | | |
| |
|
Income from continuing operations | | $ | 1,259,004 |
| | | $ | 261,164 |
| | $ | 721,209 |
| | $ | 1,078,854 |
|
Weighted average common shares outstanding | | 395,189 |
| | | 395,253 |
| | 399,223 |
| | 416,103 |
|
Incremental shares from stock options and other dilutive securities | | 5,307 |
| | | 6,023 |
| | 4,336 |
| | 5,978 |
|
Adjusted weighted average common shares outstanding | | 400,496 |
| | | 401,276 |
| | 403,559 |
| | 422,081 |
|
Earnings per share from continuing operations | | $ | 3.14 |
| | | $ | 0.65 |
| | $ | 1.79 |
| | $ | 2.56 |
|
Outstanding options to purchase 0.5 million, 6.9 million and 5.8 million shares of Common Stock were excluded from the calculations of diluted earnings per share in the years ended March 2019, December 2017 and December 2016, respectively, because the effect of their inclusion would have been antidilutive to those years. For the three months ended March 2018, all outstanding options to purchase shares were dilutive and included in the
calculation of diluted earnings per share. In addition, 0.8 million shares of performance-based RSUs were excluded from the calculations of diluted earnings per share in the year ended March 2019, and 0.9 million shares were excluded in each of the three months ended March 2018 and the years ended December 2017 and 2016 because these units were not considered to be contingent outstanding shares.
NOTE 22 — FAIR VALUE MEASUREMENTS
Financial assets and financial liabilities measured and reported at fair value are classified in a three-level hierarchy that prioritizes the inputs used in the valuation process. A financial instrument’s categorization within the valuation hierarchy is based on the lowest level of any input that is significant to the fair value measurement.
The hierarchy is based on the observability and objectivity of the pricing inputs, as follows:
| |
• | Level 1 — Quoted prices in active markets for identical assets or liabilities. |
F-52 VF Corporation Fiscal 2019 Form 10-K
VF CORPORATION
Notes to Consolidated Financial Statements
March 2019
| |
• | Level 2 — Significant directly observable data (other than Level 1 quoted prices) or significant indirectly observable data through corroboration with observable market data. Inputs would normally be (i) quoted prices in active markets for similar assets or liabilities, (ii) quoted prices in inactive markets for identical or similar assets or liabilities, or (iii) information derived from or corroborated by observable market data. |
| |
• | Level 3 — Prices or valuation techniques that require significant unobservable data inputs. These inputs would normally be VF’s own data and judgments about assumptions that market participants would use in pricing the asset or liability. |
Recurring Fair Value Measurements
The following table summarizes financial assets and financial liabilities that are measured and recorded in the consolidated financial statements at fair value on a recurring basis:
|
| | | | | | | | | | | | | | | |
| Total Fair Value | | Fair Value Measurement Using (a) |
(In thousands) | | Level 1 | | Level 2 | | Level 3 |
March 2019 | | | | | | | |
Financial assets: | | | | | | | |
Cash equivalents: | | | | | | | |
Money market funds | $ | 248,560 |
| | $ | 248,560 |
| | $ | — |
| | $ | — |
|
Time deposits | 8,257 |
| | 8,257 |
| | — |
| | — |
|
Derivative financial instruments | 92,771 |
| | — |
| | 92,771 |
| | — |
|
Investment securities | 186,698 |
| | 176,209 |
| | 10,489 |
| | — |
|
Financial liabilities: | | | | | | | |
Derivative financial instruments | 22,337 |
| | — |
| | 22,337 |
| | — |
|
Deferred compensation | 199,336 |
| | — |
| | 199,336 |
| | — |
|
| Total Fair Value | | Fair Value Measurement Using (a) |
(In thousands) | | Level 1 | | Level 2 | | Level 3 |
March 2018 | | | | | | | |
Financial assets: | | | | | | | |
Cash equivalents: | | | | | | | |
Money market funds | $ | 185,118 |
| | $ | 185,118 |
| | $ | — |
| | $ | — |
|
Time deposits | 7,714 |
| | 7,714 |
| | — |
| | — |
|
Derivative financial instruments | 31,400 |
| | — |
| | 31,400 |
| | — |
|
Investment securities | 194,160 |
| | 183,802 |
| | 10,358 |
| | — |
|
Financial liabilities: | | | | | | | |
Derivative financial instruments | 106,174 |
| | — |
| | 106,174 |
| | — |
|
Deferred compensation | 227,808 |
| | — |
| | 227,808 |
| | — |
|
| Total Fair Value | | Fair Value Measurement Using (a) |
(In thousands) | | Level 1 | | Level 2 | | Level 3 |
December 2017 | | | | | | | |
Financial assets: | | | | | | | |
Cash equivalents: | | | | | | | |
Money market funds | $ | 265,432 |
| | $ | 265,432 |
| | $ | — |
| | $ | — |
|
Time deposits | 13,591 |
| | 13,591 |
| | — |
| | — |
|
Derivative financial instruments | 22,970 |
| | — |
| | 22,970 |
| | — |
|
Investment securities | 197,837 |
| | 185,723 |
| | 12,114 |
| | — |
|
Financial liabilities: | | | | | | | |
Derivative financial instruments | 100,038 |
| | — |
| | 100,038 |
| | — |
|
Deferred compensation | 235,359 |
| | — |
| | 235,359 |
| | — |
|
| |
(a) | There were no transfers among the levels within the fair value hierarchy during the year ended March 2019, the three months ended March 2018 or the year ended December 2017. |
VF Corporation Fiscal 2019 Form 10-K F-53
VF CORPORATION
Notes to Consolidated Financial Statements
March 2019
VF’s cash equivalents include money market funds and short-term time deposits that approximate fair value based on Level 1 measurements. The fair value of derivative financial instruments, which consist of foreign exchange forward contracts, is determined based on observable market inputs (Level 2), including spot and forward exchange rates for foreign currencies, and considers the credit risk of the Company and its counterparties. Investment securities are held in VF’s deferred compensation plans as an economic hedge of the related deferred compensation liabilities (Note 15). These investments primarily include mutual funds (Level 1) that are valued based on quoted prices in active markets and a separately managed fixed-income fund (Level 2) with underlying investments that are valued based on quoted prices for similar assets in active markets or quoted prices in inactive markets for identical assets. Liabilities related to VF’s deferred compensation plans are recorded at amounts due to participants, based on the fair value of the participants’ selection of hypothetical investments.
All other financial assets and financial liabilities are recorded in the consolidated financial statements at cost, except life insurance contracts which are recorded at cash surrender value. These other financial assets and financial liabilities include cash held as demand deposits, accounts receivable, short-term borrowings, accounts payable and accrued liabilities. At March 2019, March 2018 and December 2017, their carrying values approximated their fair values. Additionally, at March 2019, March 2018 and December 2017, the carrying values of VF’s long-term debt, including the current portion, were $2,121.1 million, $2,218.8 million and $2,194.0 million, respectively, compared with fair values of $2,318.6 million, $2,403.9 million and $2,422.0 million at those respective dates. Fair value for long-term debt is a Level 2 estimate based on quoted market prices or values of comparable borrowings.
Nonrecurring Fair Value Measurements
In conjunction with the acquisitions of Williamson-Dickie, Icebreaker and Altra, the Company measured tangible and intangible assets acquired and liabilities assumed at fair value using valuation techniques including the replacement cost, market and income methods. Refer to Note 3 for additional details regarding the acquisitions and purchase price allocation.
Certain non-financial assets, primarily property, plant and equipment, goodwill and intangible assets, are not required to be measured at fair value on a recurring basis and are reported at carrying value. However, these assets are required to be assessed for impairment whenever events or circumstances indicate that their carrying value may not be fully recoverable, and at least annually for goodwill and indefinite-lived intangible assets. In the event an impairment is required, the asset is adjusted to fair value, using market-based assumptions.
The Company recorded $6.0 million, $17.2 million and $8.2 million of fixed asset impairments in the years ended March 2019, December 2017 and December 2016, respectively, related to retail store assets and other fixed assets. These impairments are recorded in the selling, general and administrative expenses line item in the Consolidated Statements of Income. There were no significant impairment charges related to property, plant and equipment in the three months ended March 2018.
Due to the change in VF's reportable segments during the first quarter of the year ended March 2019, the Timberland PRO® and
Wrangler® RIGGS brands were identified as new reporting units. Accordingly, VF was required to evaluate whether there was impairment at the historical Timberland and Jeanswear North America reporting units, and allocate to Timberland PRO and Wrangler RIGGS a portion of the respective historical reporting unit goodwill. Management performed a quantitative impairment analysis and concluded the estimated fair value of the historical reporting units exceeded the carrying value by a substantial amount, and thus the goodwill was not impaired. Management allocated $51.5 million and $7.4 million to Timberland Pro and Wrangler RIGGS, respectively, based on estimated relative fair values. The fair values of the reporting units were estimated using valuation techniques described in the Critical Accounting Policies and Estimates included in the "Management’s Discussion and Analysis" section of this Form 10-K.
Management performed its annual impairment testing of goodwill and indefinite-lived intangible assets as of the beginning of the fourth quarter of Fiscal 2019. Management performed a qualitative analysis for all reporting units and trademark intangible assets. No impairment charges of goodwill or intangible assets were recorded in the year ended March 2019 or the three months ended March 2018. See Critical Accounting Policies and Estimates within Management's Discussion and Analysis for additional discussion regarding non-recurring fair value measurements during the year ended March 2019.
No impairment charges of goodwill or intangible assets were recorded in the year ended December 2017 except for a goodwill impairment charge of $104.7 million recorded in the the three months ended September 30, 2017 related to the Nautica® brand business, which has since been reported as discontinued operations.
VF recognized impairment charges of $79.6 million in the year ended December 2016 Consolidated Statement of Income related to the lucy® brand, of which $39.3 million related to the remaining goodwill and $40.3 million related to the remaining trademark intangible asset. No other impairment charges were recorded.
Our impairment testing of goodwill, trademarks, customer relationships and license intangible assets utilizes significant unobservable inputs (Level 3) to determine fair value.
The fair value of reporting units for goodwill impairment testing is determined using a combination of two valuation methods: an income approach and a market approach. The income approach is based on projected future (debt-free) cash flows that are discounted to present value. The appropriate discount rate is based on the reporting unit’s weighted average cost of capital (“WACC”) that takes market participant assumptions into consideration. For the market approach, management uses both the guideline company and similar transaction methods. The guideline company method analyzes market multiples of revenues and earnings before interest, taxes, depreciation and amortization (“EBITDA”) for a group of comparable public companies. The market multiples used in the valuation are based on the relative strengths and weaknesses of the reporting unit compared to the selected guideline companies. Under the similar transactions method, valuation multiples are calculated utilizing actual transaction prices and revenue/EBITDA data from target companies deemed similar to the reporting unit.
Management uses the income-based relief-from-royalty method to value trademark intangible assets. Under this method, revenues
F-54 VF Corporation Fiscal 2019 Form 10-K
VF CORPORATION
Notes to Consolidated Financial Statements
March 2019
expected to be generated by the trademark are multiplied by a selected royalty rate. The royalty rate is selected based on consideration of (i) royalty rates included in active license agreements, if applicable, (ii) royalty rates received by market participants in the apparel industry, and (iii) the current performance of the reporting unit. The estimated after-tax royalty revenue stream is then discounted to present value using the reporting unit’s WACC plus a spread that factors in the risk of the intangible asset.
For the valuation of customer relationship intangible assets, management uses the multi-period excess earnings method which is a specific application of the discounted cash flows method. Under this method, VF calculates the present value of the after-tax cash
flows expected to be generated by the customer relationship asset after deducting contributory asset charges.
Management’s revenue and profitability forecasts used in the reporting unit and intangible asset valuations were developed in conjunction with management’s strategic plan review performed each fourth quarter, and our resulting revised outlook for business performance, and considered recent performance and trends, strategic initiatives and industry trends. Assumptions used in the valuations are similar to those that would be used by market participants performing independent valuations of these businesses.
NOTE 23 — DERIVATIVE FINANCIAL INSTRUMENTS AND HEDGING ACTIVITIES
Summary of Derivative Financial Instruments
All of VF’s outstanding derivative financial instruments are foreign exchange forward contracts. Although derivatives meet the criteria for hedge accounting at the inception of the hedging relationship, a limited number of derivative contracts intended to hedge assets and liabilities are not designated as hedges for accounting purposes. The notional amounts of all outstanding derivative
contracts were $2.8 billion at March 2019 and $2.9 billion at both March 2018 and December 2017, consisting primarily of contracts hedging exposures to the euro, British pound, Canadian dollar, Mexican peso, Swiss franc, Swedish krona, New Zealand dollar, South Korean won, Japanese yen, and Polish zloty. Derivative contracts have maturities up to 20 months.
The following table presents outstanding derivatives on an individual contract basis:
|
| | | | | | | | | | | | | | | | | | | | | | | | | | | |
| | Fair Value of Derivatives with Unrealized Gains | | | Fair Value of Derivatives with Unrealized Losses |
| | | | | | | | | | | | | | | |
(In thousands) | | March 2019 | | | March 2018 | | December 2017 | | | March 2019 | | | March 2018 | | December 2017 |
Foreign currency exchange contracts designated as hedging instruments | | $ | 92,356 |
| | | $ | 21,496 |
| | $ | 17,639 |
| | | $ | (21,798 | ) | | | $ | (105,795 | ) | | $ | (99,606 | ) |
Foreign currency exchange contracts not designated as hedging instruments | | 415 |
| | | 9,904 |
| | 5,331 |
| | | (539 | ) | | | (379 | ) | | (432 | ) |
Total derivatives | | $ | 92,771 |
| | | $ | 31,400 |
| | $ | 22,970 |
| | | $ | (22,337 | ) | | | $ | (106,174 | ) | | $ | (100,038 | ) |
VF records and presents the fair values of all of its derivative assets and liabilities in the Consolidated Balance Sheets on a gross basis, even though they are subject to master netting agreements. If VF were to offset and record the asset and liability balances of its foreign exchange forward contracts on a net basis in accordance with the terms of its master netting agreements, the amounts presented in the Consolidated Balance Sheets as of March 2019, March 2018 and December 2017 would be adjusted from the current gross presentation to the net amounts as detailed in the following table:
|
| | | | | | | | | | | | | | | | | | | | | | | | | |
| | March 2019 | | | March 2018 | | December 2017 |
(In thousands) | | Derivative Asset | | Derivative Liability | | | Derivative Asset | | Derivative Liability | | Derivative Asset | | Derivative Liability |
Gross amounts presented in the Consolidated Balance Sheets | | $ | 92,771 |
| | $ | (22,337 | ) | | | $ | 31,400 |
| | $ | (106,174 | ) | | $ | 22,970 |
| | $ | (100,038 | ) |
Gross amounts not offset in the Consolidated Balance Sheets | | (22,274 | ) | | 22,274 |
| | | (20,918 | ) | | 20,918 |
| | (18,313 | ) | | 18,313 |
|
Net amounts | | $ | 70,497 |
| | $ | (63 | ) | | | $ | 10,482 |
| | $ | (85,256 | ) | | $ | 4,657 |
| | $ | (81,725 | ) |
Derivatives are classified as current or noncurrent based on maturity dates, as follows:
|
| | | | | | | | | | | | | |
(In thousands) | | March 2019 | | | March 2018 | | December 2017 |
Other current assets | | $ | 83,582 |
| | | $ | 26,741 |
| | $ | 20,771 |
|
Accrued liabilities (Note 12) | | (18,590 | ) | | | (96,087 | ) | | (87,205 | ) |
Other assets (Note 10) | | 9,189 |
| | | 4,659 |
| | 2,199 |
|
Other liabilities (Note 14) | | (3,747 | ) | | | (10,087 | ) | | (12,833 | ) |
VF Corporation Fiscal 2019 Form 10-K F-55
VF CORPORATION
Notes to Consolidated Financial Statements
March 2019
Cash Flow Hedges
VF uses derivative contracts primarily to hedge a portion of the exchange risk for its forecasted sales, purchases, production costs, operating costs and intercompany royalties. The effects of cash flow hedging included in VF’s Consolidated Statements of Income and Consolidated Statements of Comprehensive Income are summarized as follows:
|
| | | | | | | | | | | | | | | | | |
(In thousands)
Cash Flow Hedging Relationships | | Gain (Loss) on Derivatives Recognized in OCI |
| | | | | | | | |
| Year Ended March | | | Three Months Ended March (Transition Period) | | Year Ended December |
| 2019 | | | 2018 | | 2017 | | 2016 |
Foreign currency exchange | | $ | 156,513 |
| | | $ | (25,530 | ) | | $ | (138,716 | ) | | $ | 90,708 |
|
|
| | | | | | | | | | | | | | | | | |
| | Gain (Loss) Reclassified from Accumulated OCI into Income |
| | | | | | | | | |
(In thousands) | | Year Ended March | | | Three Months Ended March (Transition Period) | | Year Ended December |
Location of Gain (Loss) | | 2019 | | | 2018 | | 2017 | | 2016 |
Net revenues | | $ | 1,774 |
| | | $ | 4,948 |
| | $ | 33,641 |
| | $ | 28,798 |
|
Cost of goods sold | | (20,686 | ) | | | (13,286 | ) | | 610 |
| | 84,613 |
|
Selling, general and administrative expenses | | (4,772 | ) | | | (1,981 | ) | | (3,610 | ) | | (4,314 | ) |
Other income (expense), net | | 355 |
| | | (2,427 | ) | | (1,851 | ) | | 2,864 |
|
Interest expense | | (5,012 | ) | | | (1,214 | ) | | (4,723 | ) | | (4,504 | ) |
Total | | $ | (28,341 | ) | | | $ | (13,960 | ) | | $ | 24,067 |
| | $ | 107,457 |
|
Derivative Contracts Not Designated as Hedges
VF uses derivative contracts to manage foreign currency exchange risk on third-party accounts receivable and payable, as well as intercompany borrowings. These contracts are not designated as hedges, and are recorded at fair value in the Consolidated Balance Sheets. Changes in the fair values of these instruments are recognized directly in earnings. Gains or losses on these contracts largely offset the net transaction losses or gains on the related assets and liabilities. In the case of derivative contracts executed on foreign currency exposures that are no longer probable of occurring, VF de-designates these hedges and the fair value changes of these instruments are also recognized directly in earnings.
In addition, VF entered into foreign exchange forward contracts to hedge the purchase price of the Icebreaker acquisition. These contracts were not designated as hedges, and were recorded at fair value in the Consolidated Balance Sheets. Changes in the fair values of these instruments were recognized directly in earnings. All contracts were settled in conjunction with the acquisition.
The changes in fair value of derivative contracts not designated as hedges that have been recognized as gains or losses in VF's Consolidated Statements of Income were not material for the year ended March 2019, the three months ended March 2018, and the years ended December 2017 and 2016.
Other Derivative Information
There were no significant amounts recognized in earnings for the ineffective portion of any hedging relationships during the year ended March 2019, the three months ended March 2018 and the years ended December 2017 and 2016.
At March 2019, accumulated OCI included $70.3 million of pre-tax net deferred losses for foreign currency exchange contracts that are expected to be reclassified to earnings during the next 12 months. The amounts ultimately reclassified to earnings will depend on exchange rates in effect when outstanding derivative contracts are settled.
VF entered into interest rate swap derivative contracts in 2011 and 2003 to hedge the interest rate risk for issuance of long-term debt due in 2021 and 2033, respectively. In each case, the contracts were terminated concurrent with the issuance of the debt, and the realized gain or loss was deferred in accumulated OCI. The remaining pre-tax net deferred loss in accumulated OCI was $11.7 million at March 2019, which will be reclassified into interest expense in the Consolidated Statements of Income over the remaining terms of the associated debt instruments. During the year ended March 2019, the three months ended March 2018 and the years ended December 2017 and 2016, VF reclassified $5.0 million, $1.2 million, $4.7 million and $4.5 million, respectively, of net deferred losses from accumulated OCI into interest expense. VF expects to reclassify $5.3 million to interest expense during the next 12 months.
Net Investment Hedge
The Company has designated its €850.0 million of euro-denominated fixed-rate notes as a net investment hedge of VF’s investment in certain foreign operations. Because this debt qualified as a nonderivative hedging instrument, foreign currency transaction gains or losses of the debt are deferred in the foreign currency translation and other component of accumulated OCI as an offset to the foreign currency translation adjustments on the hedged investments. During the year ended March 2019, the three months ended March 2018 and the years ended December 2017 and 2016, the Company recognized an after-tax gain of $69.5
F-56 VF Corporation Fiscal 2019 Form 10-K
VF CORPORATION
Notes to Consolidated Financial Statements
March 2019
million, an after-tax loss of $19.2 million, an after-tax loss of $92.9 million and an after-tax gain of $34.4 million, respectively, in OCI related to the net investment hedge transaction. Any amounts deferred in accumulated OCI will remain until the hedged
investment is sold or substantially liquidated. The Company recorded no ineffectiveness from its net investment hedge during the year ended March 2019, the three months ended March 2018 and the years ended December 2017 and 2016.
NOTE 24 — SUPPLEMENTAL CASH FLOW INFORMATION
|
| | | | | | | | | | | | | | | | | |
| | Year Ended March | | | Three Months Ended March (Transition Period) | | Year Ended December |
(In thousands) | | 2019 | | | 2018 | | 2017 | | 2016 |
Income taxes paid, net of refunds | | $ | 359,821 |
| | | $ | 105,635 |
| | $ | 331,194 |
| | $ | 434,795 |
|
Interest paid, net of amounts capitalized | | 102,749 |
| | | 13,553 |
| | 99,939 |
| | 87,521 |
|
Noncash transactions: | | | | | | | | | |
Property, plant and equipment expenditures included in accounts payable or accrued liabilities | | 29,824 |
| | | 22,495 |
| | 26,146 |
| | 28,103 |
|
Computer software costs included in accounts payable or accrued liabilities | | 14,842 |
| | | 21,144 |
| | 22,880 |
| | 15,143 |
|
The cash flows related to discontinued operations have not been segregated, and are included in the Consolidated Statements of Cash Flows. Accordingly, the information above includes the results of continuing and discontinued operations.
NOTE 25 — RESTRUCTURING
The Company typically incurs restructuring charges related to strategic initiatives and cost optimization of business activities, primarily related to severance and employee-related benefits.
Of the $107.6 million of restructuring charges recognized in the year ended March 2019, $70.2 million were reflected in selling, general and administrative expenses and $37.4 million in cost of goods sold. Of the $14.9 million million of restructuring charges recognized in the three months ended March 2018, $10.8 million were reflected in selling, general and administrative expenses and $4.1 million in cost of goods sold. Of the $27.0 million of restructuring charges recognized in the year ended December 2017, $20.2 million were reflected in selling, general and administrative expenses and $6.8 million in cost of goods sold. Of
the $55.1 million of restructuring charges recognized in the year ended December 2016, $31.8 million were reflected in selling, general and administrative expenses and $23.3 million in cost of goods sold.
The Company did not recognize significant incremental costs related to the actions for the years ended December 2017 and 2016 during the three months ended March 2018 or the year ended March 2019, and has completed most of the related restructuring activities as of March 2019. Of the total restructuring accrual at March 2019, $86.6 million is expected to be paid out within the next 12 months and is classified within accrued liabilities. The remaining $5.7 million will be paid out beyond the next 12 months and thus is classified within other liabilities.
The components of the restructuring charges are as follows:
|
| | | | | | | | | | | | | | | | | |
(In thousands) | | Year Ended March 2019 Charges | | | Three Months Ended March 2018 Charges | | Year Ended December 2017 Charges | | Year Ended December 2016 Charges |
Severance and employee-related benefits | | $ | 79,693 |
| | | $ | 14,927 |
| | $ | 22,611 |
| | $ | 50,395 |
|
Asset impairments | | 5,705 |
| | | — |
| | — |
| | 3,394 |
|
Inventory write-downs | | 6,574 |
| | | — |
| | — |
| | — |
|
Contract termination and other | | 15,643 |
| | | — |
| | 4,436 |
| | 1,310 |
|
Total restructuring charges | | $ | 107,615 |
| | | $ | 14,927 |
| | $ | 27,047 |
| | $ | 55,099 |
|
VF Corporation Fiscal 2019 Form 10-K F-57
VF CORPORATION
Notes to Consolidated Financial Statements
March 2019
Restructuring costs by business segment are as follows:
|
| | | | | | | | | | | | | | | | | |
(In thousands) | | Year Ended March 2019 Charges | | | Three Months Ended March 2018 Charges | | Year Ended December 2017 Charges | | Year Ended December 2016 Charges |
Outdoor | | $ | 38,952 |
| | | $ | 4,550 |
| | $ | 10,393 |
| | $ | 14,137 |
|
Active | | 13,579 |
| | | — |
| | 2,400 |
| | 3,946 |
|
Work | | 10,003 |
| | | 7,802 |
| | 3,895 |
| | 1,308 |
|
Jeans | | 39,936 |
| | | 2,575 |
| | 6,993 |
| | 20,357 |
|
Other | | 167 |
| | | — |
| | — |
| | 1,277 |
|
Corporate | | 4,978 |
| | | — |
| | 3,366 |
| | 14,074 |
|
Total | | $ | 107,615 |
| | | $ | 14,927 |
| | $ | 27,047 |
| | $ | 55,099 |
|
The activity in the restructuring accrual is as follows:
|
| | | | | | | | | | | | | |
(In thousands) | | Severance | | Other | | Total | |
Accrual at December 2016 | | $ | 49,728 |
| | $ | 878 |
| | $ | 50,606 |
| |
Charges | | 22,611 |
| | 4,436 |
| | 27,047 |
| |
Cash payments and settlements | | (37,349 | ) | | (878 | ) | | (38,227 | ) | |
Adjustments to accruals | | (2,783 | ) | | — |
| | (2,783 | ) | |
Currency translation | | 1,601 |
| | — |
| | 1,601 |
| |
Accrual at December 2017 | | 33,808 |
| | 4,436 |
| | 38,244 |
| |
Charges | | 14,927 |
| | — |
| | 14,927 |
| |
Cash payments and settlements | | (4,658 | ) | | (3,992 | ) | | (8,650 | ) | |
Adjustments to accruals | | (1,033 | ) | | — |
| | (1,033 | ) | |
Currency translation | | 101 |
| | — |
| | 101 |
| |
Accrual at March 2018 | | 43,145 |
| | 444 |
| | 43,589 |
| |
Charges | | 79,693 |
| | 15,643 |
| | 95,336 |
| |
Cash payments and settlements | | (35,530 | ) | | (4,917 | ) | | (40,447 | ) | |
Adjustments to accruals | | (5,800 | ) | | 100 |
| | (5,700 | ) | |
Currency translation | | (272 | ) | | (235 | ) | | (507 | ) | |
Accrual at March 2019 | | $ | 81,236 |
| | $ | 11,035 |
| | $ | 92,271 |
| |
The Company has incurred costs associated with the relocation of VF's global headquarters and certain brands to Denver, Colorado. The total amount of charges recognized for the year ended March 2019 was $47.4 million, of which $18.8 million relates to severance and employee-related benefits and is included in the tables above. The remaining $28.6 million relates to other relocation costs, the majority of which has been paid as of March 2019.
NOTE 26 — SUBSEQUENT EVENTS
On May 14, 2019, VF’s Board of Directors declared a quarterly cash dividend of $0.51 per share, payable on June 20, 2019 to shareholders of record on June 10, 2019.
On May 19, 2019, Switzerland voted to approve the Federal Act on Tax Reform and AHV Financing (“Swiss Tax Act”). The Company is currently evaluating the Swiss Tax Act and the associated tax effects will be reflected in VF’s first quarter of Fiscal 2020, which is the period that the Swiss Tax Act was enacted. We believe the Swiss Tax Act may have a material impact to the Company’s tax expense.
On May 22, 2019, VF completed the spin-off of its Jeans business with the new company now operating as an independent, publicly
traded company under the name Kontoor Brands, Inc. ("Kontoor Brands"). As a result, beginning in the first quarter of Fiscal 2020, Kontoor Brands' historical financial results through the date of separation will be reported as a discontinued operation in VF's consolidated financial statements. The spin-off is effected through a distribution to VF shareholders of one share of Kontoor Brands common stock for every seven shares of VF common stock held on the record date of May 10, 2019. In connection with the spin-off, Kontoor Brands transferred net proceeds of approximately $1.0 billion to VF and its subsidiaries from its new debt issuance.
F-58 VF Corporation Fiscal 2019 Form 10-K
VF CORPORATION
Notes to Consolidated Financial Statements
March 2019
NOTE 27 — QUARTERLY RESULTS OF OPERATIONS (UNAUDITED)
|
| | | | | | | | | | | | | | | | | | | | |
(In thousands, except per share amounts) | First
Quarter (a) | | Second
Quarter (a) (b) | | Third
Quarter (a) (b) | | Fourth
Quarter (a) (b) (c) | | Full
Year | |
Year Ended March 2019 | | | | | | | | | | |
Net revenues | $ | 2,788,146 |
| | $ | 3,907,386 |
| | $ | 3,940,159 |
| | $ | 3,212,969 |
| | $ | 13,848,660 |
| |
Operating income | 230,882 |
| | 658,669 |
| | 591,905 |
| | 194,384 |
| | 1,675,840 |
| |
Income from continuing operations | 159,953 |
| | 507,121 |
| | 463,126 |
| | 128,804 |
| | 1,259,004 |
| |
Income from discontinued operations, net of tax | 405 |
| | — |
| | 383 |
| | — |
| | 788 |
| |
Net income | $ | 160,358 |
| | $ | 507,121 |
| | $ | 463,509 |
| | $ | 128,804 |
| | $ | 1,259,792 |
| |
Earnings per common share - basic (g) | | | | | | | | | | |
Continuing operations | $ | 0.41 |
| | $ | 1.28 |
| | $ | 1.17 |
| | $ | 0.33 |
| | $ | 3.19 |
| |
Discontinued operations | — |
| | — |
| | — |
| | — |
| | — |
| |
Total earnings per common share - basic | $ | 0.41 |
| | $ | 1.28 |
| | $ | 1.17 |
| | $ | 0.33 |
| | $ | 3.19 |
| |
Earnings per common share - diluted (g) | | | | | | | | | | |
Continuing operations | $ | 0.40 |
| | $ | 1.26 |
| | $ | 1.16 |
| | $ | 0.32 |
| | $ | 3.14 |
| |
Discontinued operations | — |
| | — |
| | — |
| | — |
| | — |
| |
Total earnings per common share - diluted | $ | 0.40 |
| | $ | 1.26 |
| | $ | 1.16 |
| | $ | 0.32 |
| | $ | 3.15 |
| |
Dividends per common share | $ | 0.46 |
| | $ | 0.46 |
| | $ | 0.51 |
| | $ | 0.51 |
| | $ | 1.94 |
| |
(In thousands, except per share amounts) | First
Quarter | | Second
Quarter | | Third
Quarter | | Fourth
Quarter (d) (e) | | Full
Year | |
Year Ended December 2017 | | | | | | | | | | |
Net revenues | $ | 2,500,340 |
| | $ | 2,268,620 |
| | $ | 3,392,934 |
| | $ | 3,649,283 |
| | $ | 11,811,177 |
| |
Operating income (f) | 293,207 |
| | 159,676 |
| | 575,527 |
| | 484,619 |
| | 1,513,029 |
| |
Income (loss) from continuing operations | 213,276 |
| | 107,092 |
| | 473,820 |
| | (72,979 | ) | | 721,209 |
| |
Loss (income) from discontinued operations, net of tax | (4,113 | ) | | 2,797 |
| | (87,680 | ) | | (17,290 | ) | | (106,286 | ) | |
Net income | $ | 209,163 |
| | $ | 109,889 |
| | $ | 386,140 |
| | $ | (90,269 | ) | | $ | 614,923 |
| |
Earnings (loss) per common share - basic (g) | | | | | | | | | | |
Continuing operations | $ | 0.52 |
| | $ | 0.27 |
| | $ | 1.20 |
| | $ | (0.18 | ) | | $ | 1.81 |
| |
Discontinued operations | (0.01 | ) | | 0.01 |
| | (0.22 | ) | | (0.04 | ) | | (0.27 | ) | |
Total earnings (loss) per common share - basic | $ | 0.51 |
| | $ | 0.28 |
| | $ | 0.98 |
| | $ | (0.23 | ) | | $ | 1.54 |
| |
Earnings (loss) per common share - diluted (g) | | | | | | | | | | |
Continuing operations | $ | 0.51 |
| | $ | 0.27 |
| | $ | 1.19 |
| | $ | (0.18 | ) | | $ | 1.79 |
| |
Discontinued operations | (0.01 | ) | | 0.01 |
| | (0.22 | ) | | (0.04 | ) | | (0.26 | ) | |
Total earnings (loss) per common share - diluted | $ | 0.50 |
| | $ | 0.27 |
| | $ | 0.97 |
| | $ | (0.23 | ) | | $ | 1.52 |
| |
Dividends per common share | $ | 0.42 |
| | $ | 0.42 |
| | $ | 0.42 |
| | $ | 0.46 |
| | $ | 1.72 |
| |
| |
(a) | VF recorded transaction and deal-related costs of $18.8 million ($15.3 million after-tax), $53.2 million ($45.5 million after-tax), $62.6 million ($47.5 million after-tax) and $57.1 million ($43.7 million after-tax) during the three months ended June 30, 2018, September 29, 2018, December 29, 2018 and March 30, 2019, respectively. Full year transaction and deal-related costs totaled $191.7 million ($152.0 million after-tax). Transaction and deal-related costs include acquisition and integration costs related to the acquisitions of Williamson-Dickie, Icebreaker and Altra, and divestiture costs related to the sale of the Reef® brand business. The costs also include separation and related expenses associated with the planned spin-off of the Jeans business and non-operating losses on sale related primarily to the divestitures of the Reef® brand business and Van Moer business. |
| |
(b) | VF recorded relocation costs of $10.7 million ($8.0 million after-tax), $6.0 million ($4.4 million after-tax) and $30.7 million ($22.9 million after-tax) during the three months ended September 29, 2018, December 29, 2018 and March 30, 2019, respectively. Full year relocation costs totaled $47.4 million ($35.3 million after-tax). Relocation costs primarily include costs associated with the relocation of VF's global headquarters and certain brands to Denver, Colorado. |
| |
(c) | VF recorded costs related to strategic business decisions to cease operations in Argentina and planned business model changes in certain other countries in Central and South America, which totaled $30.5 million ($30.5 million after-tax) during the three months ended March 30, 2019. |
| |
(d) | VF recorded transaction and deal-related costs of $15.6 million ($13.6 million after-tax) during the fourth quarter of the year ended December 2017. |
| |
(e) | VF recorded a $465.5 million provisional tax charge during the fourth quarter of the year ended December 2017 related to the transitional impact of the Tax Act (Note 18). |
| |
(f) | In the first quarter of Fiscal 2019, VF adopted ASU 2017-07, "Compensation - Retirement Benefits (Topic 715): Improving the Presentation of Net Periodic Pension Cost and Net Periodic Postretirement Benefit Cost" and restated the prior periods to conform to current year presentation. Operating income increased and other income (expense), net decreased by $3.5 million, $1.6 million, $1.5 million and $3.3 million for the three months ended April 1, 2017, July, 1 2017, September 30, 2017 and December 30, 2017, respectively. Full year operating income increased and other income (expense), net decreased by $9.9 million. |
| |
(g) | Per share amounts are computed independently for each quarter presented using unrounded numbers. The sum of the quarters may not equal the total year amount due to the impact of changes in average quarterly shares outstanding and rounding. |
VF Corporation Fiscal 2019 Form 10-K F-59
Schedule II — Valuation and Qualifying Accounts
|
| | | | | | | | | | | | | | | | | | | | |
COL. A | COL. B | | COL. C | | COL. D | | COL. E | |
| | | ADDITIONS | | | | | |
Description | Balance at Beginning of Period | | (1) Charged to Costs and Expenses | | (2) Charged to Other Accounts | | Deductions | | Balance at End of Period | |
(In thousands) | | |
Year Ended March 2019 | | | | | | | | | | |
Allowance for doubtful accounts | $ | 24,993 |
| | $ | 22,553 |
| | $ | — |
| | $ | 19,170 |
| (a) | $ | 28,376 |
| |
Valuation allowance for deferred income tax assets | $ | 226,269 |
| | — |
| | — |
|
| 38,011 |
| (b) | $ | 188,258 |
| |
Three Months Ended March 2018 | | | | | | | | | | |
Allowance for doubtful accounts | $ | 26,266 |
| | 2,659 |
| | — |
| | 3,932 |
| (a) | $ | 24,993 |
| |
Other accounts receivable allowances | $ | 208,995 |
| | 465,413 |
| | — |
| | 478,453 |
| (c) | $ | 195,955 |
| |
Valuation allowance for deferred income tax assets | $ | 225,141 |
| | — |
| | 1,128 |
| (d) | — |
| | $ | 226,269 |
| |
Year Ended December 2017 | | | | | | | | | | |
Allowance for doubtful accounts | $ | 20,538 |
| | 21,046 |
| | — |
| | 15,318 |
| (a) | $ | 26,266 |
| |
Other accounts receivable allowances | $ | 157,835 |
| | 1,613,257 |
| | — |
| | 1,562,097 |
| (c) | $ | 208,995 |
| |
Valuation allowance for deferred income tax assets | $ | 114,990 |
| | — |
| | 110,151 |
| (d) | — |
| | $ | 225,141 |
| |
Year Ended December 2016 | | | | | | | | | | |
Allowance for doubtful accounts | $ | 22,990 |
| | 16,684 |
| | — |
| | 19,136 |
| (a) | $ | 20,538 |
| |
Other accounts receivable allowances | $ | 161,745 |
| | 1,482,855 |
| | — |
| | 1,486,765 |
| (c) | $ | 157,835 |
| |
Valuation allowance for deferred income tax assets | $ | 100,951 |
| | — |
| | 14,039 |
| (d) | — |
| | $ | 114,990 |
| |
| |
(a) | Deductions include accounts written off, net of recoveries, and the effects of foreign currency translation. |
| |
(b) | Deductions relate to changes in circumstances which increase the amount of deferred income tax assets that will, more likely than not, be realized, and the effects of foreign currency translation. |
| |
(c) | Deductions include discounts, markdowns and returns, and the effects of foreign currency translation. |
| |
(d) | Additions relate to circumstances where it is more likely than not that deferred income tax assets will not be realized and the effects of foreign currency translation. |
F-60 VF Corporation Fiscal 2019 Form 10-K