Exhibit 99.2 Kontoor Brands Investor Presentation April 26, 2019Exhibit 99.2 Kontoor Brands Investor Presentation April 26, 2019
Disclaimer Certain written and oral statements included in this presentation are forward- looking statements within the meaning of the federal securities laws. Forward-looking statements are made based on our expectations and beliefs concerning future events impacting Kontoor Brands and therefore involve several risks and uncertainties that are difficult to predict. You can identify these statements by the fact that they use words such as “will,” “anticipate,” “estimate,” “expect,” “should,” “may,” “believe,” “appear,” “intend,” “plan,” “assume,” “seek,” “forecast,” and other words and terms of similar meaning or use of future dates. We caution that forward-looking statements are not guarantees and that actual results could differ materially from those expressed or implied in the forward-looking statements. Potential risks and uncertainties that could cause the actual results of operations or financial condition of Kontoor Brands to differ materially from those expressed or implied by forward-looking statements in this release include, but are not limited to: foreign currency fluctuations; the level of consumer demand for apparel, footwear and accessories; disruption to Kontoor Brands’ distribution system; Kontoor Brands' reliance on a small number of large customers; the financial strength of Kontoor Brands’ customers; fluctuations in the price, availability and quality of raw materials and contracted products; disruption and volatility in the global capital and credit markets; Kontoor Brands’ response to changing fashion trends, evolving consumer preferences and changing patterns of consumer behavior, intense competition from online retailers, manufacturing and ® product innovation; increasing pressure on margins; Kontoor Brands’ ability to implement its business strategy; risks associated with relocating our Lee headquarters from Kansas City; Kontoor Brands’ ability to grow its international and direct-to-consumer businesses; Kontoor Brands’ and its customers’ and vendors’ ability to maintain the strength and security of information technology systems; stability of Kontoor Brands’ manufacturing facilities and foreign suppliers; continued use by Kontoor Brands’ suppliers of ethical business practices; Kontoor Brands’ ability to accurately forecast demand for products; continuity of members of Kontoor Brands’ management; Kontoor Brands’ ability to protect trademarks and other intellectual property rights; possible goodwill and other asset impairment; maintenance by Kontoor Brands’ licensees and distributors of the value of Kontoor Brands’ brands; changes in tax liabilities; legal, reputational, regulatory, political and economic risks; adverse or unexpected weather conditions; fluctuations in wage rates; financial difficulty within the retail industry; our ability to secure short-term financing and maintain the proper liquidity; and risks associated with our proposed spin-off, including risks associated with operating separately from VF Corporation and the risks and costs associated with operating as a separate public company, and our ability to realize the expected benefit of the spin-off. More information on potential factors that could affect our financial results is included in our Registration Statement on Form 10 filed with the Securities and Exchange Commission. Our forward-looking statements in this presentation speak only as of the date of this presentation. Factors or events that could cause our actual results to differ may emerge from time to time, and it is not possible for us to predict all of them. Unless required by law, we undertake no obligation to update publicly any forward-looking statements as a result of new information, future events or otherwise. Financial information contained in this presentation includes certain financial measures that are calculated and presented on the basis of methodologies other than in accordance with generally accepted accounting policies in the United States of America (GAAP), which include or exclude certain items from the most directly comparable GAAP financial measure. These non-GAAP measures differ from reported GAAP measures and are intended to illustrate what management believes are relevant period-over-period comparisons and are helpful to investors as an additional tool for further understanding and assessing VF and Kontoor’s expected ongoing operating performance. Such non-GAAP measures should be viewed in addition to, and not as an alternative for, reported results under GAAP. Please refer to the appendix to this presentation for definitions of the non-GAAP financial measures used herein and reconciliations of each non-GAAP financial measure to the most directly comparable GAAP financial measure. Certain market and/or industry data used in this presentation were obtained from market research and publicly available information. Such information may include data obtained from sources believed to be reliable, however VF disclaims the accuracy and completeness of such information which is not guaranteed. Basis of Presentation Financial information provided throughout this presentation represents Kontoor Brands’ 52/53 week fiscal year ending on the Saturday closest to December 31 of each year. 2Disclaimer Certain written and oral statements included in this presentation are forward- looking statements within the meaning of the federal securities laws. Forward-looking statements are made based on our expectations and beliefs concerning future events impacting Kontoor Brands and therefore involve several risks and uncertainties that are difficult to predict. You can identify these statements by the fact that they use words such as “will,” “anticipate,” “estimate,” “expect,” “should,” “may,” “believe,” “appear,” “intend,” “plan,” “assume,” “seek,” “forecast,” and other words and terms of similar meaning or use of future dates. We caution that forward-looking statements are not guarantees and that actual results could differ materially from those expressed or implied in the forward-looking statements. Potential risks and uncertainties that could cause the actual results of operations or financial condition of Kontoor Brands to differ materially from those expressed or implied by forward-looking statements in this release include, but are not limited to: foreign currency fluctuations; the level of consumer demand for apparel, footwear and accessories; disruption to Kontoor Brands’ distribution system; Kontoor Brands' reliance on a small number of large customers; the financial strength of Kontoor Brands’ customers; fluctuations in the price, availability and quality of raw materials and contracted products; disruption and volatility in the global capital and credit markets; Kontoor Brands’ response to changing fashion trends, evolving consumer preferences and changing patterns of consumer behavior, intense competition from online retailers, manufacturing and ® product innovation; increasing pressure on margins; Kontoor Brands’ ability to implement its business strategy; risks associated with relocating our Lee headquarters from Kansas City; Kontoor Brands’ ability to grow its international and direct-to-consumer businesses; Kontoor Brands’ and its customers’ and vendors’ ability to maintain the strength and security of information technology systems; stability of Kontoor Brands’ manufacturing facilities and foreign suppliers; continued use by Kontoor Brands’ suppliers of ethical business practices; Kontoor Brands’ ability to accurately forecast demand for products; continuity of members of Kontoor Brands’ management; Kontoor Brands’ ability to protect trademarks and other intellectual property rights; possible goodwill and other asset impairment; maintenance by Kontoor Brands’ licensees and distributors of the value of Kontoor Brands’ brands; changes in tax liabilities; legal, reputational, regulatory, political and economic risks; adverse or unexpected weather conditions; fluctuations in wage rates; financial difficulty within the retail industry; our ability to secure short-term financing and maintain the proper liquidity; and risks associated with our proposed spin-off, including risks associated with operating separately from VF Corporation and the risks and costs associated with operating as a separate public company, and our ability to realize the expected benefit of the spin-off. More information on potential factors that could affect our financial results is included in our Registration Statement on Form 10 filed with the Securities and Exchange Commission. Our forward-looking statements in this presentation speak only as of the date of this presentation. Factors or events that could cause our actual results to differ may emerge from time to time, and it is not possible for us to predict all of them. Unless required by law, we undertake no obligation to update publicly any forward-looking statements as a result of new information, future events or otherwise. Financial information contained in this presentation includes certain financial measures that are calculated and presented on the basis of methodologies other than in accordance with generally accepted accounting policies in the United States of America (GAAP), which include or exclude certain items from the most directly comparable GAAP financial measure. These non-GAAP measures differ from reported GAAP measures and are intended to illustrate what management believes are relevant period-over-period comparisons and are helpful to investors as an additional tool for further understanding and assessing VF and Kontoor’s expected ongoing operating performance. Such non-GAAP measures should be viewed in addition to, and not as an alternative for, reported results under GAAP. Please refer to the appendix to this presentation for definitions of the non-GAAP financial measures used herein and reconciliations of each non-GAAP financial measure to the most directly comparable GAAP financial measure. Certain market and/or industry data used in this presentation were obtained from market research and publicly available information. Such information may include data obtained from sources believed to be reliable, however VF disclaims the accuracy and completeness of such information which is not guaranteed. Basis of Presentation Financial information provided throughout this presentation represents Kontoor Brands’ 52/53 week fiscal year ending on the Saturday closest to December 31 of each year. 2
Introductions and Agenda AGENDA KONTOOR BRANDS ATTENDEES 1. Kontoor Brands Investment Thesis Scott Baxter President, CEO, Board Member 2. Our Brands and Business Rustin Welton 3. Our Strategy Vice President, CFO 4. Financial Overview Eric Tracy Senior Director, Investor Relations 5. Conclusion 3Introductions and Agenda AGENDA KONTOOR BRANDS ATTENDEES 1. Kontoor Brands Investment Thesis Scott Baxter President, CEO, Board Member 2. Our Brands and Business Rustin Welton 3. Our Strategy Vice President, CFO 4. Financial Overview Eric Tracy Senior Director, Investor Relations 5. Conclusion 3
44
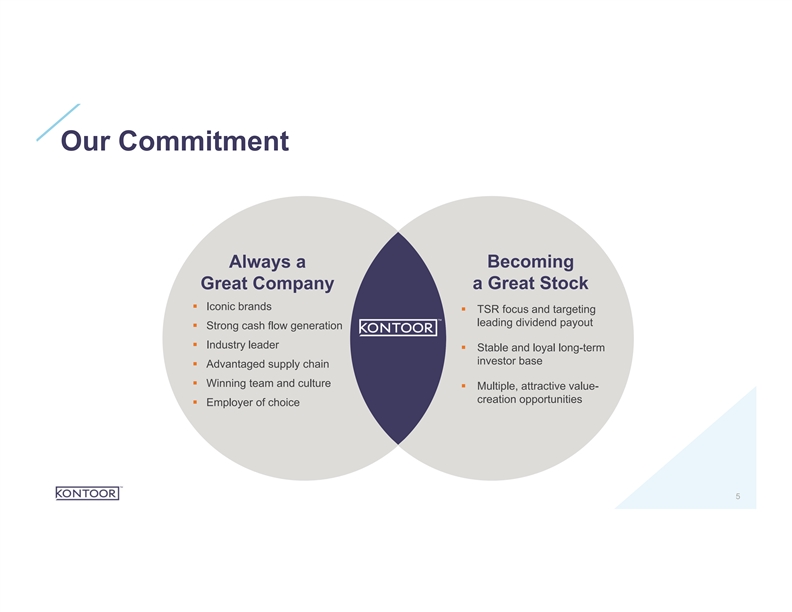
Our Commitment Always a Becoming Great Company a Great Stock § Iconic brands § TSR focus and targeting leading dividend payout § Strong cash flow generation § Industry leader § Stable and loyal long-term investor base § Advantaged supply chain § Winning team and culture § Multiple, attractive value- creation opportunities § Employer of choice 5Our Commitment Always a Becoming Great Company a Great Stock § Iconic brands § TSR focus and targeting leading dividend payout § Strong cash flow generation § Industry leader § Stable and loyal long-term investor base § Advantaged supply chain § Winning team and culture § Multiple, attractive value- creation opportunities § Employer of choice 5
Compelling Opportunities to Unlock Value § Target paying a best-in-class dividend § Invest behind strategic and operational priorities ® ® § Pursue a broader set of product, channel and geographic opportunities for Wrangler and Lee brands § Build and incentivize a world-class team with a global mindset and focus on culture § Establish conservative capital structure to unlock current and future value drivers § Align strong and durable free cash flow (FCF) with a total shareholder return (TSR) focused capital allocation strategy 6Compelling Opportunities to Unlock Value § Target paying a best-in-class dividend § Invest behind strategic and operational priorities ® ® § Pursue a broader set of product, channel and geographic opportunities for Wrangler and Lee brands § Build and incentivize a world-class team with a global mindset and focus on culture § Establish conservative capital structure to unlock current and future value drivers § Align strong and durable free cash flow (FCF) with a total shareholder return (TSR) focused capital allocation strategy 6

Kontoor is an Attractive Investment Opportunity STRONG FINANCIAL MODEL SHAREHOLDER-FOCUSED CAPITAL DEPLOYMENT Strong dividend policy Compelling, durable & consistent cash flow Compelling dividend yield funded by >$300M in annual operating cash flows 60% target payout Committed to a healthy balance sheet Healthy margin expansion 1 Long-term adjusted gross leverage target of <3x Identified >$50 million in cost reductions Focused deployment of excess free cash flow Sustainable growth Attractive dividend yield, de-lever debt and consider Profitable, low single digit growth attractive future growth opportunities SOURCES OF ADVANTAGE Two iconic brands | VF DNA | Supply chain excellence | Strong relationships with winning retailers | Experienced management team 1 Definitions of non-GAAP measures and GAAP to non-GAAP reconciliations are included in the appendix to this presentation. 7Kontoor is an Attractive Investment Opportunity STRONG FINANCIAL MODEL SHAREHOLDER-FOCUSED CAPITAL DEPLOYMENT Strong dividend policy Compelling, durable & consistent cash flow Compelling dividend yield funded by >$300M in annual operating cash flows 60% target payout Committed to a healthy balance sheet Healthy margin expansion 1 Long-term adjusted gross leverage target of <3x Identified >$50 million in cost reductions Focused deployment of excess free cash flow Sustainable growth Attractive dividend yield, de-lever debt and consider Profitable, low single digit growth attractive future growth opportunities SOURCES OF ADVANTAGE Two iconic brands | VF DNA | Supply chain excellence | Strong relationships with winning retailers | Experienced management team 1 Definitions of non-GAAP measures and GAAP to non-GAAP reconciliations are included in the appendix to this presentation. 7
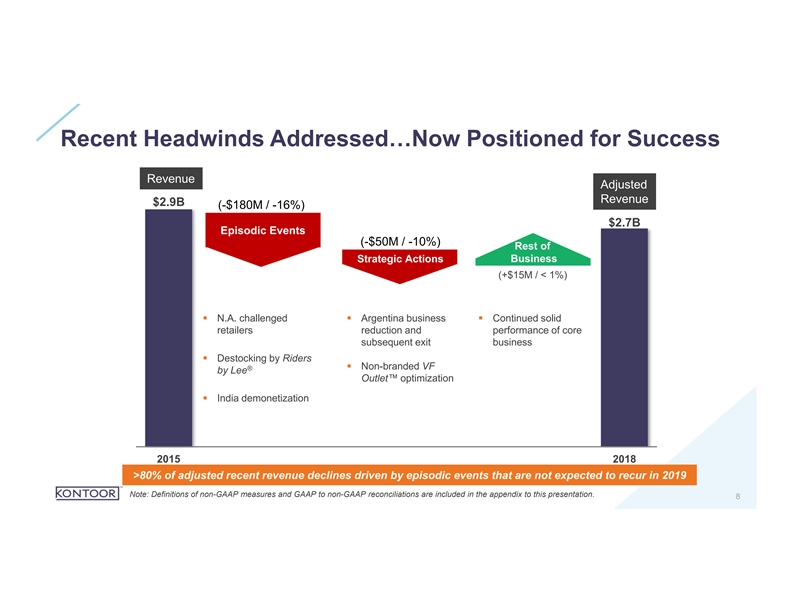
Recent Headwinds Addressed…Now Positioned for Success Revenue Adjusted Revenue $2.9B (-$180M / -16%) $2.7B Episodic Events (-$50M / -10%) Rest of Strategic Actions Business (+$15M / < 1%) § N.A. challenged § Argentina business § Continued solid retailers reduction and performance of core subsequent exit business § Destocking by Riders § Non-branded VF ® by Lee Outlet™ optimization § India demonetization 2015 2018 >80% of adjusted recent revenue declines driven by episodic events that are not expected to recur in 2019 Note: Definitions of non-GAAP measures and GAAP to non-GAAP reconciliations are included in the appendix to this presentation. 8Recent Headwinds Addressed…Now Positioned for Success Revenue Adjusted Revenue $2.9B (-$180M / -16%) $2.7B Episodic Events (-$50M / -10%) Rest of Strategic Actions Business (+$15M / < 1%) § N.A. challenged § Argentina business § Continued solid retailers reduction and performance of core subsequent exit business § Destocking by Riders § Non-branded VF ® by Lee Outlet™ optimization § India demonetization 2015 2018 >80% of adjusted recent revenue declines driven by episodic events that are not expected to recur in 2019 Note: Definitions of non-GAAP measures and GAAP to non-GAAP reconciliations are included in the appendix to this presentation. 8
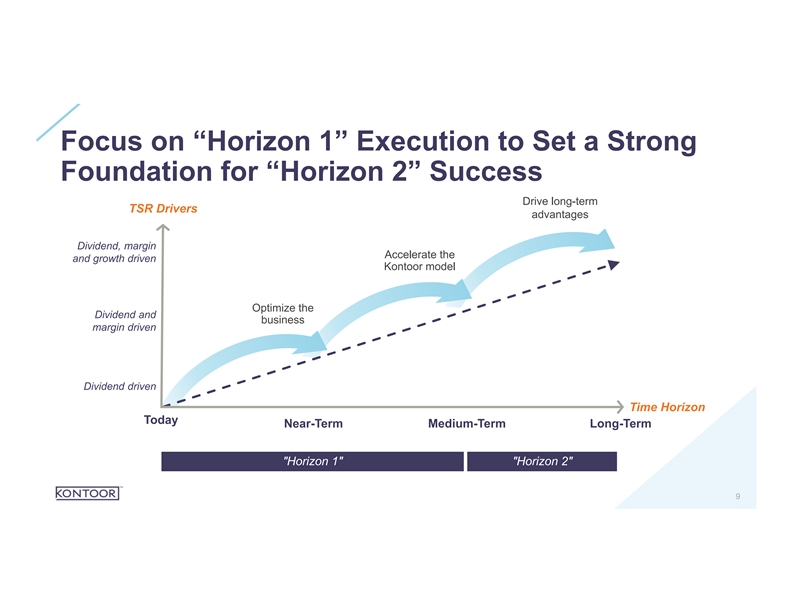
Focus on “Horizon 1” Execution to Set a Strong Foundation for “Horizon 2” Success Drive long-term TSR Drivers advantages Dividend, margin Accelerate the and growth driven Kontoor model Optimize the Dividend and business margin driven Dividend driven Time Horizon Today Near-Term Medium-Term Long-Term Horizon 1 Horizon 2 9Focus on “Horizon 1” Execution to Set a Strong Foundation for “Horizon 2” Success Drive long-term TSR Drivers advantages Dividend, margin Accelerate the and growth driven Kontoor model Optimize the Dividend and business margin driven Dividend driven Time Horizon Today Near-Term Medium-Term Long-Term Horizon 1 Horizon 2 9
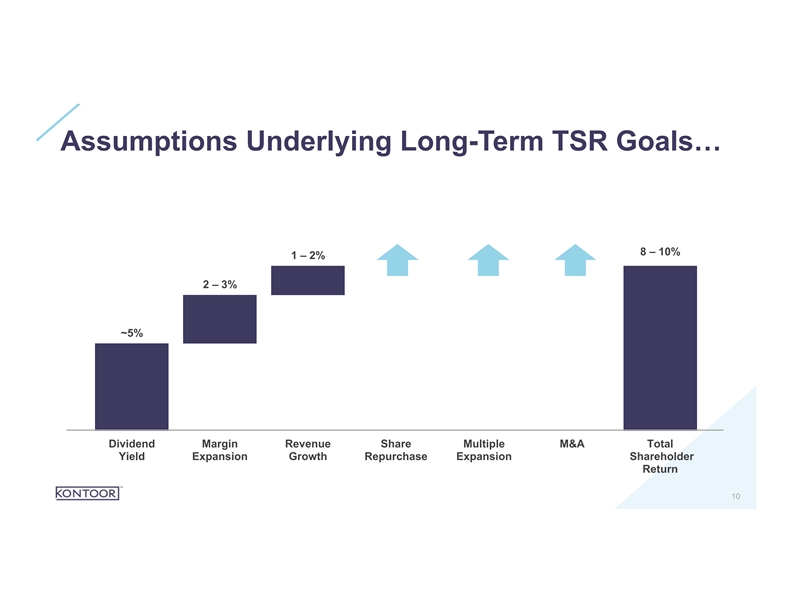
Assumptions Underlying Long-Term TSR Goals… 8 – 10% 1 – 2% 2 – 3% ~5% Dividend Margin Revenue Share Multiple M&A Total Yield Expansion Growth Repurchase Expansion Shareholder Return 10Assumptions Underlying Long-Term TSR Goals… 8 – 10% 1 – 2% 2 – 3% ~5% Dividend Margin Revenue Share Multiple M&A Total Yield Expansion Growth Repurchase Expansion Shareholder Return 10
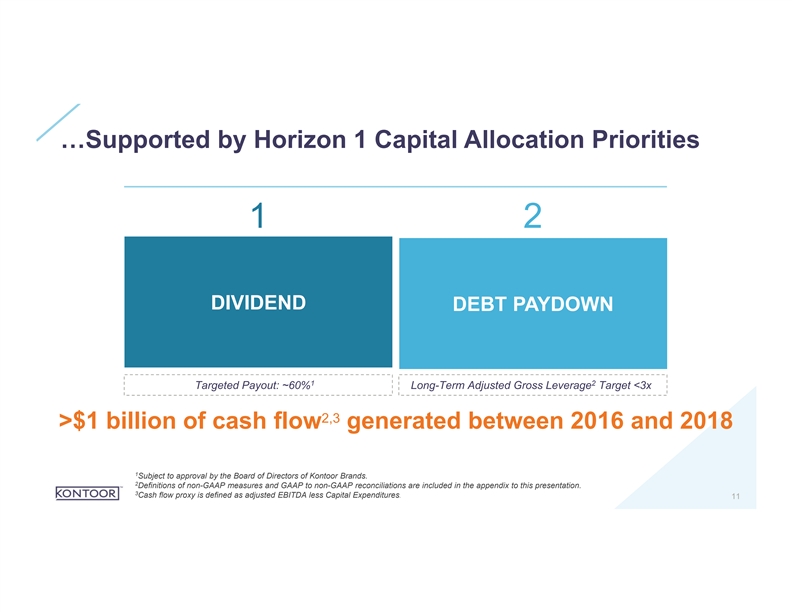
…Supported by Horizon 1 Capital Allocation Priorities 1 2 DIVIDEND DEBT PAYDOWN 1 2 Targeted Payout: ~60% Long-Term Adjusted Gross Leverage Target <3x 2,3 >$1 billion of cash flow generated between 2016 and 2018 1 Subject to approval by the Board of Directors of Kontoor Brands. 2 Definitions of non-GAAP measures and GAAP to non-GAAP reconciliations are included in the appendix to this presentation. 3 Cash flow proxy is defined as adjusted EBITDA less Capital Expenditures. 11…Supported by Horizon 1 Capital Allocation Priorities 1 2 DIVIDEND DEBT PAYDOWN 1 2 Targeted Payout: ~60% Long-Term Adjusted Gross Leverage Target <3x 2,3 >$1 billion of cash flow generated between 2016 and 2018 1 Subject to approval by the Board of Directors of Kontoor Brands. 2 Definitions of non-GAAP measures and GAAP to non-GAAP reconciliations are included in the appendix to this presentation. 3 Cash flow proxy is defined as adjusted EBITDA less Capital Expenditures. 11
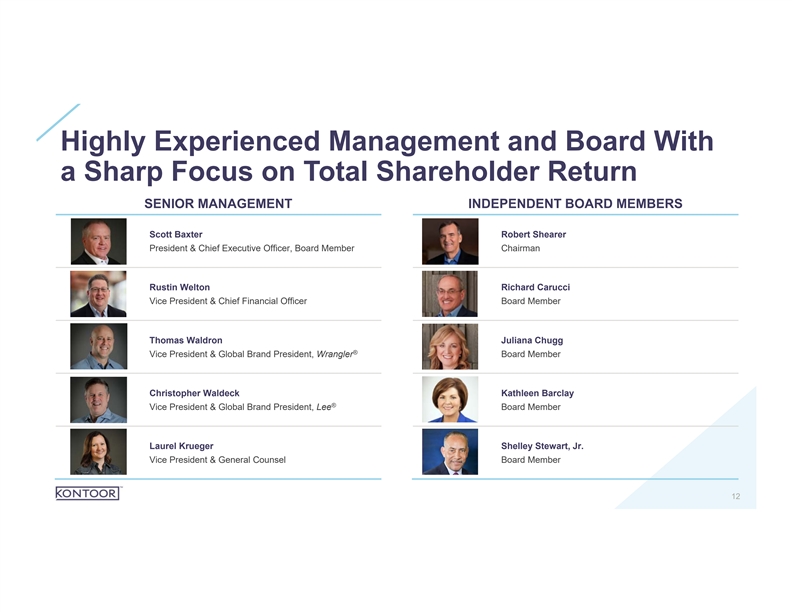
Highly Experienced Management and Board With a Sharp Focus on Total Shareholder Return SENIOR MANAGEMENT INDEPENDENT BOARD MEMBERS Scott Baxter Robert Shearer President & Chief Executive Officer, Board Member Chairman Rustin Welton Richard Carucci Vice President & Chief Financial Officer Board Member Thomas Waldron Juliana Chugg ® Vice President & Global Brand President, Wrangler Board Member Christopher Waldeck Kathleen Barclay ® Vice President & Global Brand President, Lee Board Member Laurel Krueger Shelley Stewart, Jr. Photo To Vice President & General Counsel Board Member Come 12Highly Experienced Management and Board With a Sharp Focus on Total Shareholder Return SENIOR MANAGEMENT INDEPENDENT BOARD MEMBERS Scott Baxter Robert Shearer President & Chief Executive Officer, Board Member Chairman Rustin Welton Richard Carucci Vice President & Chief Financial Officer Board Member Thomas Waldron Juliana Chugg ® Vice President & Global Brand President, Wrangler Board Member Christopher Waldeck Kathleen Barclay ® Vice President & Global Brand President, Lee Board Member Laurel Krueger Shelley Stewart, Jr. Photo To Vice President & General Counsel Board Member Come 12

Our Brands & Business 13Our Brands & Business 13
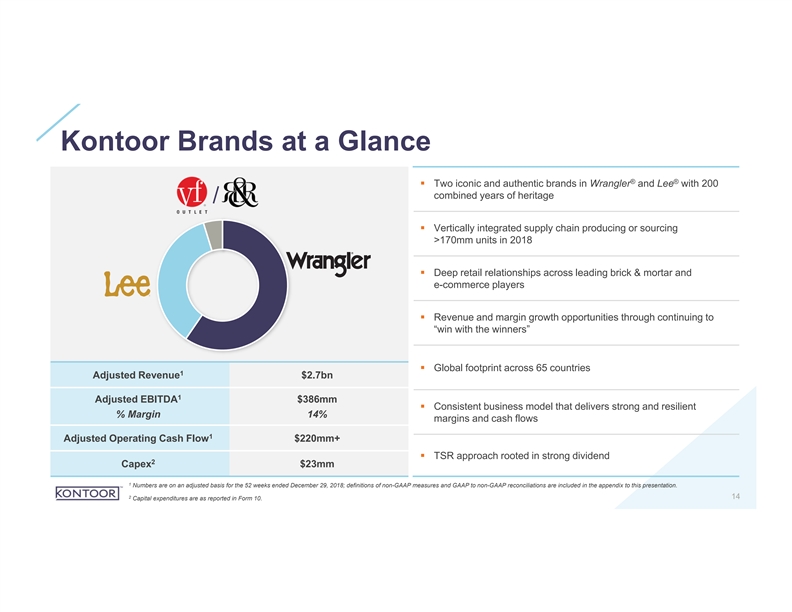
Kontoor Brands at a Glance ® ® § Two iconic and authentic brands in Wrangler and Lee with 200 combined years of heritage § Vertically integrated supply chain producing or sourcing >170mm units in 2018 § Deep retail relationships across leading brick & mortar and e-commerce players § Revenue and margin growth opportunities through continuing to “win with the winners” § Global footprint across 65 countries 1 Adjusted Revenue $2.7bn 1 Adjusted EBITDA $386mm § Consistent business model that delivers strong and resilient % Margin 14% margins and cash flows 1 Adjusted Operating Cash Flow $220mm+ § TSR approach rooted in strong dividend 2 Capex $23mm 1 Numbers are on an adjusted basis for the 52 weeks ended December 29, 2018; definitions of non-GAAP measures and GAAP to non-GAAP reconciliations are included in the appendix to this presentation. 2 14 Capital expenditures are as reported in Form 10.Kontoor Brands at a Glance ® ® § Two iconic and authentic brands in Wrangler and Lee with 200 combined years of heritage § Vertically integrated supply chain producing or sourcing >170mm units in 2018 § Deep retail relationships across leading brick & mortar and e-commerce players § Revenue and margin growth opportunities through continuing to “win with the winners” § Global footprint across 65 countries 1 Adjusted Revenue $2.7bn 1 Adjusted EBITDA $386mm § Consistent business model that delivers strong and resilient % Margin 14% margins and cash flows 1 Adjusted Operating Cash Flow $220mm+ § TSR approach rooted in strong dividend 2 Capex $23mm 1 Numbers are on an adjusted basis for the 52 weeks ended December 29, 2018; definitions of non-GAAP measures and GAAP to non-GAAP reconciliations are included in the appendix to this presentation. 2 14 Capital expenditures are as reported in Form 10.
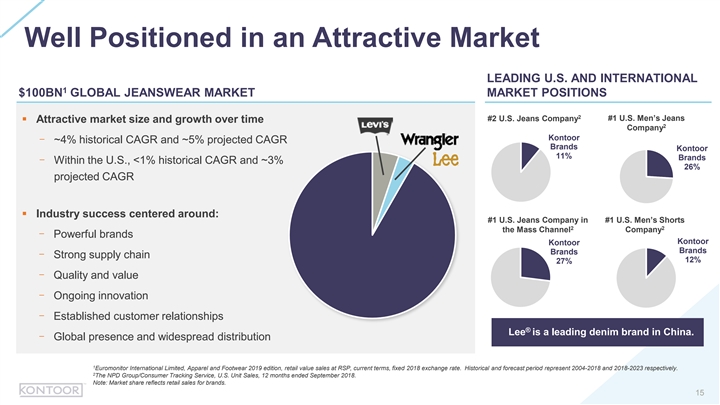
Well Positioned in an Attractive Market LEADING U.S. AND INTERNATIONAL 1 $100BN GLOBAL JEANSWEAR MARKET MARKET POSITIONS 2 #2 U.S. Jeans Company #1 U.S. Men’s Jeans § Attractive market size and growth over time 2 Company Kontoor - ~4% historical CAGR and ~5% projected CAGR Brands Kontoor 11% Brands - Within the U.S., <1% historical CAGR and ~3% 26% projected CAGR § Industry success centered around: #1 U.S. Jeans Company in #1 U.S. Men’s Shorts 2 2 the Mass Channel Company - Powerful brands Kontoor Kontoor Brands Brands - Strong supply chain 12% 27% - Quality and value - Ongoing innovation - Established customer relationships ® Lee is a leading denim brand in China. - Global presence and widespread distribution 1 Euromonitor International Limited, Apparel and Footwear 2019 edition, retail value sales at RSP, current terms, fixed 2018 exchange rate. Historical and forecast period represent 2004-2018 and 2018-2023 respectively. 2 The NPD Group/Consumer Tracking Service, U.S. Unit Sales, 12 months ended September 2018. Note: Market share reflects retail sales for brands. 15Well Positioned in an Attractive Market LEADING U.S. AND INTERNATIONAL 1 $100BN GLOBAL JEANSWEAR MARKET MARKET POSITIONS 2 #2 U.S. Jeans Company #1 U.S. Men’s Jeans § Attractive market size and growth over time 2 Company Kontoor - ~4% historical CAGR and ~5% projected CAGR Brands Kontoor 11% Brands - Within the U.S., <1% historical CAGR and ~3% 26% projected CAGR § Industry success centered around: #1 U.S. Jeans Company in #1 U.S. Men’s Shorts 2 2 the Mass Channel Company - Powerful brands Kontoor Kontoor Brands Brands - Strong supply chain 12% 27% - Quality and value - Ongoing innovation - Established customer relationships ® Lee is a leading denim brand in China. - Global presence and widespread distribution 1 Euromonitor International Limited, Apparel and Footwear 2019 edition, retail value sales at RSP, current terms, fixed 2018 exchange rate. Historical and forecast period represent 2004-2018 and 2018-2023 respectively. 2 The NPD Group/Consumer Tracking Service, U.S. Unit Sales, 12 months ended September 2018. Note: Market share reflects retail sales for brands. 15
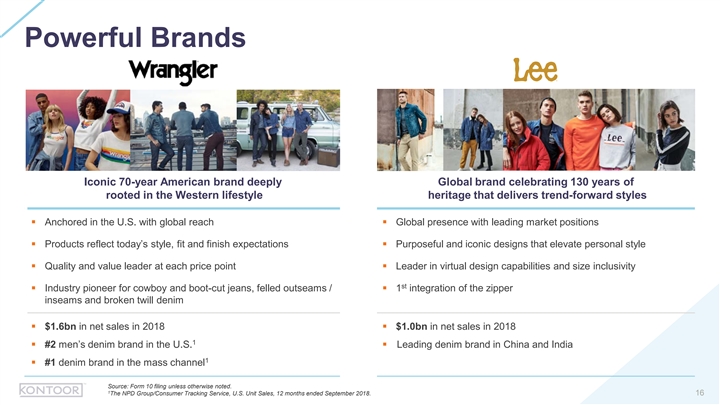
Powerful Brands Iconic 70-year American brand deeply Global brand celebrating 130 years of rooted in the Western lifestyle heritage that delivers trend-forward styles § Anchored in the U.S. with global reach§ Global presence with leading market positions § Products reflect today’s style, fit and finish expectations§ Purposeful and iconic designs that elevate personal style § Quality and value leader at each price point§ Leader in virtual design capabilities and size inclusivity st § Industry pioneer for cowboy and boot-cut jeans, felled outseams / § 1 integration of the zipper inseams and broken twill denim § $1.6bn in net sales in 2018§ $1.0bn in net sales in 2018 1 § #2 men’s denim brand in the U.S.§ Leading denim brand in China and India 1 § #1 denim brand in the mass channel Source: Form 10 filing unless otherwise noted. 1 The NPD Group/Consumer Tracking Service, U.S. Unit Sales, 12 months ended September 2018. 16Powerful Brands Iconic 70-year American brand deeply Global brand celebrating 130 years of rooted in the Western lifestyle heritage that delivers trend-forward styles § Anchored in the U.S. with global reach§ Global presence with leading market positions § Products reflect today’s style, fit and finish expectations§ Purposeful and iconic designs that elevate personal style § Quality and value leader at each price point§ Leader in virtual design capabilities and size inclusivity st § Industry pioneer for cowboy and boot-cut jeans, felled outseams / § 1 integration of the zipper inseams and broken twill denim § $1.6bn in net sales in 2018§ $1.0bn in net sales in 2018 1 § #2 men’s denim brand in the U.S.§ Leading denim brand in China and India 1 § #1 denim brand in the mass channel Source: Form 10 filing unless otherwise noted. 1 The NPD Group/Consumer Tracking Service, U.S. Unit Sales, 12 months ended September 2018. 16
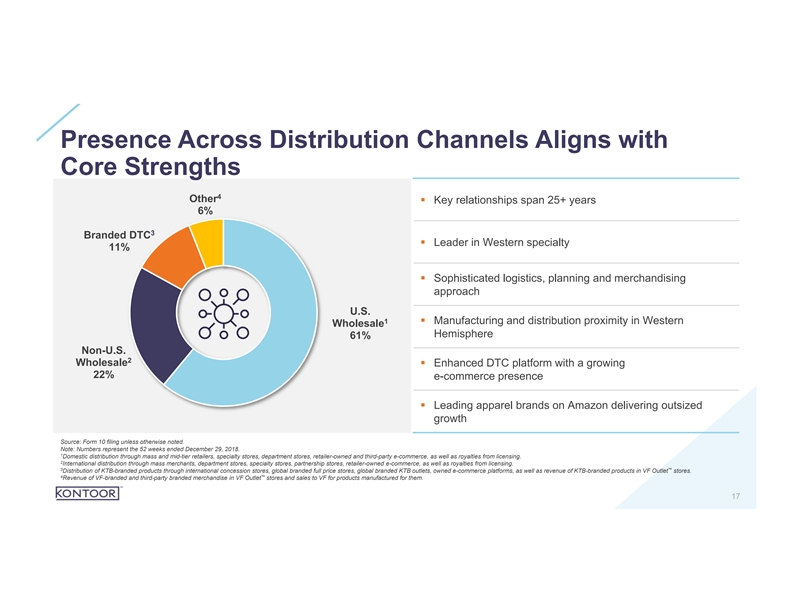
Presence Across Distribution Channels Aligns with Core Strengths 4 Other § Key relationships span 25+ years 6% 3 Branded DTC § Leader in Western specialty 11% § Sophisticated logistics, planning and merchandising approach U.S. 1 § Manufacturing and distribution proximity in Western Wholesale Hemisphere 61% Non-U.S. 2 Wholesale § Enhanced DTC platform with a growing 22% e-commerce presence § Leading apparel brands on Amazon delivering outsized growth Source: Form 10 filing unless otherwise noted. Note: Numbers represent the 52 weeks ended December 29, 2018. 1 Domestic distribution through mass and mid-tier retailers, specialty stores, department stores, retailer-owned and third-party e-commerce, as well as royalties from licensing. 2 International distribution through mass merchants, department stores, specialty stores, partnership stores, retailer-owned e-commerce, as well as royalties from licensing. 3 ™ Distribution of KTB-branded products through international concession stores, global branded full price stores, global branded KTB outlets, owned e-commerce platforms, as well as revenue of KTB-branded products in VF Outlet stores. 4 ™ Revenue of VF-branded and third-party branded merchandise in VF Outlet stores and sales to VF for products manufactured for them. 17Presence Across Distribution Channels Aligns with Core Strengths 4 Other § Key relationships span 25+ years 6% 3 Branded DTC § Leader in Western specialty 11% § Sophisticated logistics, planning and merchandising approach U.S. 1 § Manufacturing and distribution proximity in Western Wholesale Hemisphere 61% Non-U.S. 2 Wholesale § Enhanced DTC platform with a growing 22% e-commerce presence § Leading apparel brands on Amazon delivering outsized growth Source: Form 10 filing unless otherwise noted. Note: Numbers represent the 52 weeks ended December 29, 2018. 1 Domestic distribution through mass and mid-tier retailers, specialty stores, department stores, retailer-owned and third-party e-commerce, as well as royalties from licensing. 2 International distribution through mass merchants, department stores, specialty stores, partnership stores, retailer-owned e-commerce, as well as royalties from licensing. 3 ™ Distribution of KTB-branded products through international concession stores, global branded full price stores, global branded KTB outlets, owned e-commerce platforms, as well as revenue of KTB-branded products in VF Outlet stores. 4 ™ Revenue of VF-branded and third-party branded merchandise in VF Outlet stores and sales to VF for products manufactured for them. 17
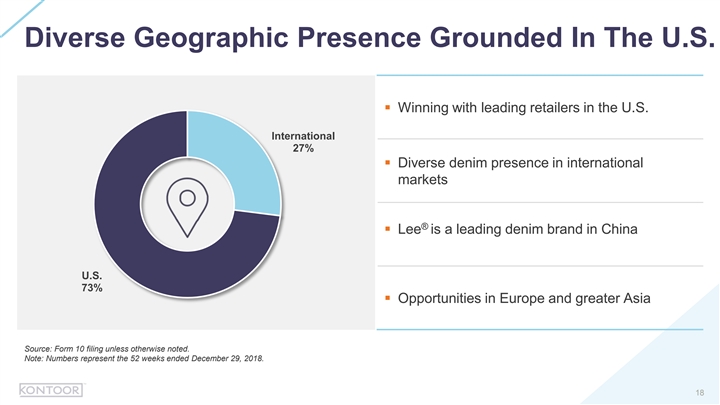
Diverse Geographic Presence Grounded In The U.S. § Winning with leading retailers in the U.S. International 27% § Diverse denim presence in international markets ® § Lee is a leading denim brand in China U.S. 73% § Opportunities in Europe and greater Asia Source: Form 10 filing unless otherwise noted. Note: Numbers represent the 52 weeks ended December 29, 2018. 18Diverse Geographic Presence Grounded In The U.S. § Winning with leading retailers in the U.S. International 27% § Diverse denim presence in international markets ® § Lee is a leading denim brand in China U.S. 73% § Opportunities in Europe and greater Asia Source: Form 10 filing unless otherwise noted. Note: Numbers represent the 52 weeks ended December 29, 2018. 18
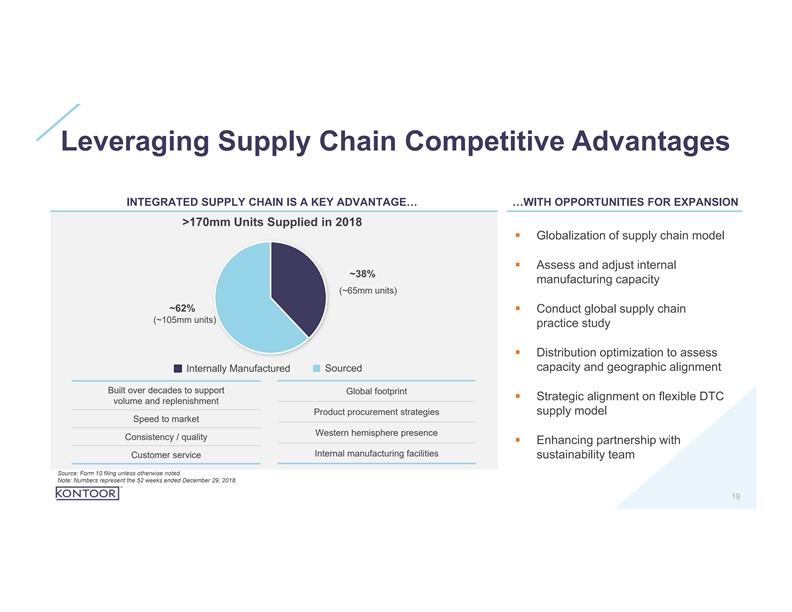
Leveraging Supply Chain Competitive Advantages INTEGRATED SUPPLY CHAIN IS A KEY ADVANTAGE… …WITH OPPORTUNITIES FOR EXPANSION >170mm Units Supplied in 2018 § Globalization of supply chain model § Assess and adjust internal ~38% manufacturing capacity (~65mm units) ~62% § Conduct global supply chain (~105mm units) practice study § Distribution optimization to assess capacity and geographic alignment Internally Manufactured Sourced Built over decades to support Global footprint § Strategic alignment on flexible DTC volume and replenishment Product procurement strategies supply model Speed to market Western hemisphere presence Consistency / quality § Enhancing partnership with Internal manufacturing facilities Customer service sustainability team Source: Form 10 filing unless otherwise noted. Note: Numbers represent the 52 weeks ended December 29, 2018. 19Leveraging Supply Chain Competitive Advantages INTEGRATED SUPPLY CHAIN IS A KEY ADVANTAGE… …WITH OPPORTUNITIES FOR EXPANSION >170mm Units Supplied in 2018 § Globalization of supply chain model § Assess and adjust internal ~38% manufacturing capacity (~65mm units) ~62% § Conduct global supply chain (~105mm units) practice study § Distribution optimization to assess capacity and geographic alignment Internally Manufactured Sourced Built over decades to support Global footprint § Strategic alignment on flexible DTC volume and replenishment Product procurement strategies supply model Speed to market Western hemisphere presence Consistency / quality § Enhancing partnership with Internal manufacturing facilities Customer service sustainability team Source: Form 10 filing unless otherwise noted. Note: Numbers represent the 52 weeks ended December 29, 2018. 19
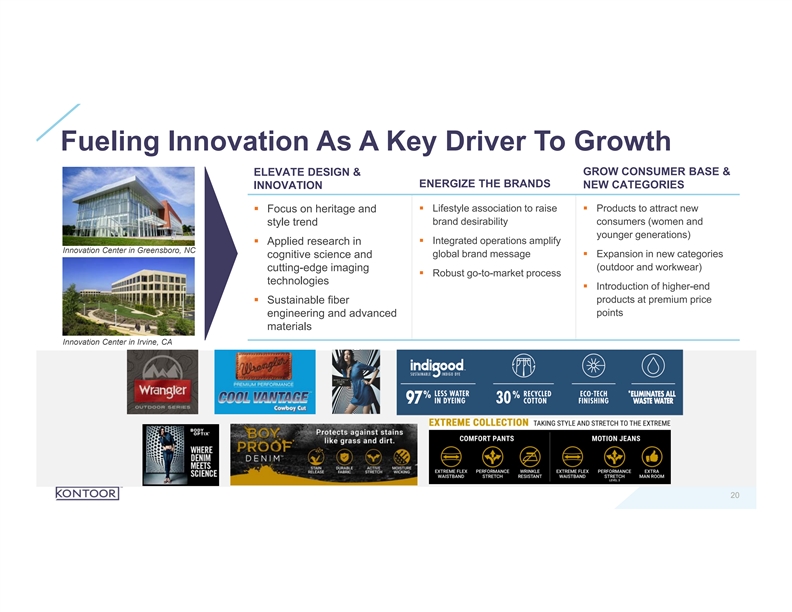
Fueling Innovation As A Key Driver To Growth GROW CONSUMER BASE & ELEVATE DESIGN & ENERGIZE THE BRANDS NEW CATEGORIES INNOVATION § Focus on heritage and § Lifestyle association to raise § Products to attract new brand desirability consumers (women and style trend younger generations) § Integrated operations amplify § Applied research in Innovation Center in Greensboro, NC global brand message§ Expansion in new categories cognitive science and cutting-edge imaging (outdoor and workwear) § Robust go-to-market process technologies § Introduction of higher-end products at premium price § Sustainable fiber points engineering and advanced materials Innovation Center in Irvine, CA 20Fueling Innovation As A Key Driver To Growth GROW CONSUMER BASE & ELEVATE DESIGN & ENERGIZE THE BRANDS NEW CATEGORIES INNOVATION § Focus on heritage and § Lifestyle association to raise § Products to attract new brand desirability consumers (women and style trend younger generations) § Integrated operations amplify § Applied research in Innovation Center in Greensboro, NC global brand message§ Expansion in new categories cognitive science and cutting-edge imaging (outdoor and workwear) § Robust go-to-market process technologies § Introduction of higher-end products at premium price § Sustainable fiber points engineering and advanced materials Innovation Center in Irvine, CA 20
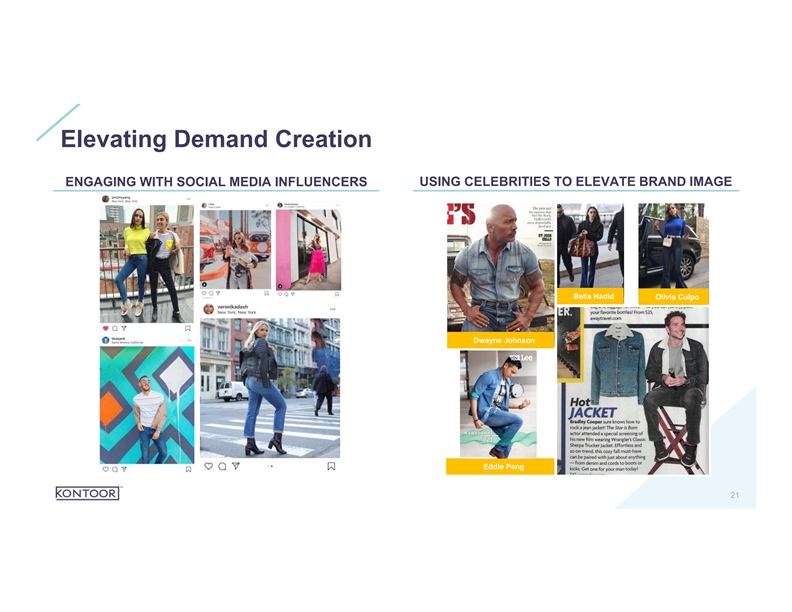
Elevating Demand Creation ENGAGING WITH SOCIAL MEDIA INFLUENCERS USING CELEBRITIES TO ELEVATE BRAND IMAGE Bella Hadid Olivia Culpo Dwayne Johnson Eddie Peng 21Elevating Demand Creation ENGAGING WITH SOCIAL MEDIA INFLUENCERS USING CELEBRITIES TO ELEVATE BRAND IMAGE Bella Hadid Olivia Culpo Dwayne Johnson Eddie Peng 21
Our Strategy 22Our Strategy 22
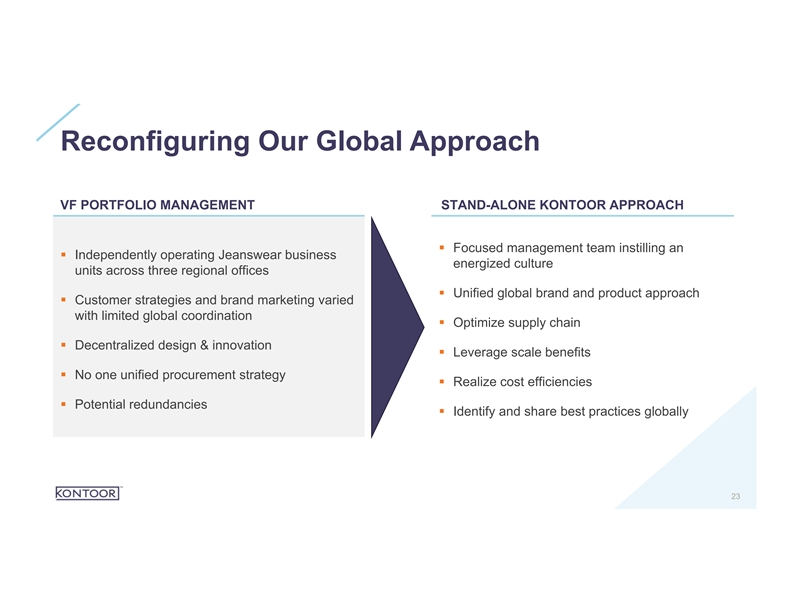
Reconfiguring Our Global Approach VF PORTFOLIO MANAGEMENT STAND-ALONE KONTOOR APPROACH § Focused management team instilling an § Independently operating Jeanswear business energized culture units across three regional offices § Unified global brand and product approach § Customer strategies and brand marketing varied with limited global coordination § Optimize supply chain § Decentralized design & innovation § Leverage scale benefits § No one unified procurement strategy § Realize cost efficiencies § Potential redundancies § Identify and share best practices globally 23Reconfiguring Our Global Approach VF PORTFOLIO MANAGEMENT STAND-ALONE KONTOOR APPROACH § Focused management team instilling an § Independently operating Jeanswear business energized culture units across three regional offices § Unified global brand and product approach § Customer strategies and brand marketing varied with limited global coordination § Optimize supply chain § Decentralized design & innovation § Leverage scale benefits § No one unified procurement strategy § Realize cost efficiencies § Potential redundancies § Identify and share best practices globally 23
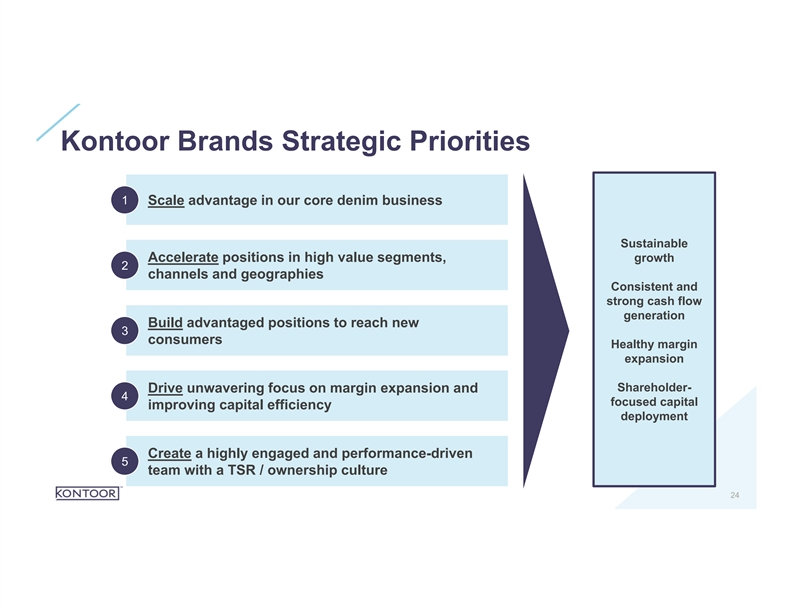
Kontoor Brands Strategic Priorities 1 Scale advantage in our core denim business Sustainable Accelerate positions in high value segments, growth 2 channels and geographies Consistent and strong cash flow generation Build advantaged positions to reach new 3 consumers Healthy margin expansion Shareholder- Drive unwavering focus on margin expansion and 4 focused capital improving capital efficiency deployment Create a highly engaged and performance-driven 5 team with a TSR / ownership culture 24Kontoor Brands Strategic Priorities 1 Scale advantage in our core denim business Sustainable Accelerate positions in high value segments, growth 2 channels and geographies Consistent and strong cash flow generation Build advantaged positions to reach new 3 consumers Healthy margin expansion Shareholder- Drive unwavering focus on margin expansion and 4 focused capital improving capital efficiency deployment Create a highly engaged and performance-driven 5 team with a TSR / ownership culture 24
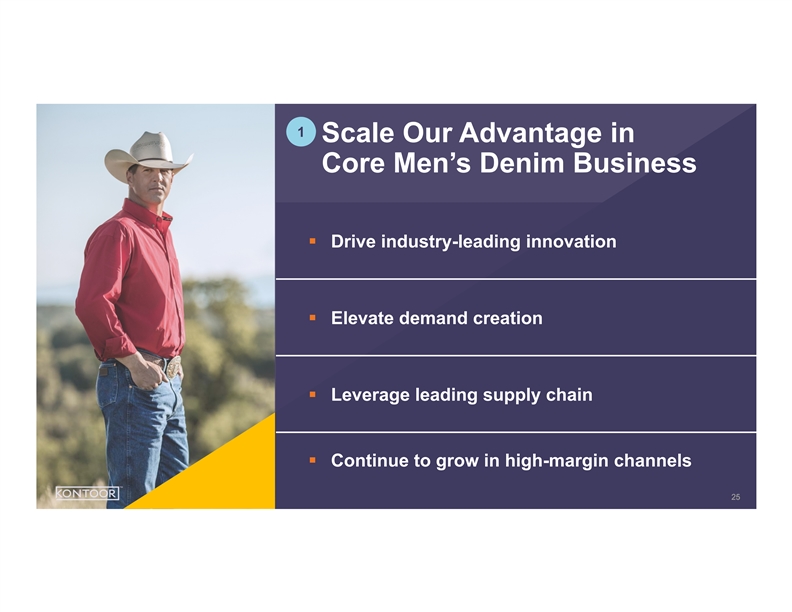
1 Scale Our Advantage in Core Men’s Denim Business § Drive industry-leading innovation § Elevate demand creation § Leverage leading supply chain § Continue to grow in high-margin channels 25 251 Scale Our Advantage in Core Men’s Denim Business § Drive industry-leading innovation § Elevate demand creation § Leverage leading supply chain § Continue to grow in high-margin channels 25 25
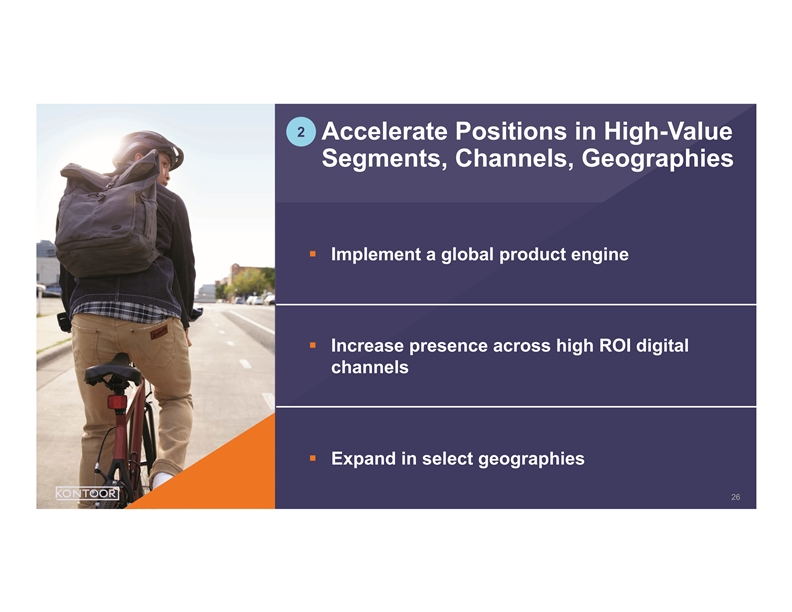
2 Accelerate Positions in High-Value Segments, Channels, Geographies § Implement a global product engine § Increase presence across high ROI digital channels § Expand in select geographies 26 262 Accelerate Positions in High-Value Segments, Channels, Geographies § Implement a global product engine § Increase presence across high ROI digital channels § Expand in select geographies 26 26

3 Build Advantaged Positions to Reach New Consumers § Grow new categories and segments § Foster world-class design § Maintain consumer focus 27 273 Build Advantaged Positions to Reach New Consumers § Grow new categories and segments § Foster world-class design § Maintain consumer focus 27 27
4 Drive Unwavering Focus on Margin Expansion and Capital Efficiency § Focus on margin accretive opportunities § Streamline global operations § Implement cost-savings initiatives § Efficiently allocate capital 28 284 Drive Unwavering Focus on Margin Expansion and Capital Efficiency § Focus on margin accretive opportunities § Streamline global operations § Implement cost-savings initiatives § Efficiently allocate capital 28 28
5 Create an Engaged and High-Performing Team With a TSR / Ownership Culture § Activate a high-performance culture § Instill TSR / ownership processes, culture and mindset § Enhance corporate social responsibility 29 295 Create an Engaged and High-Performing Team With a TSR / Ownership Culture § Activate a high-performance culture § Instill TSR / ownership processes, culture and mindset § Enhance corporate social responsibility 29 29

Financial Overview 30Financial Overview 30
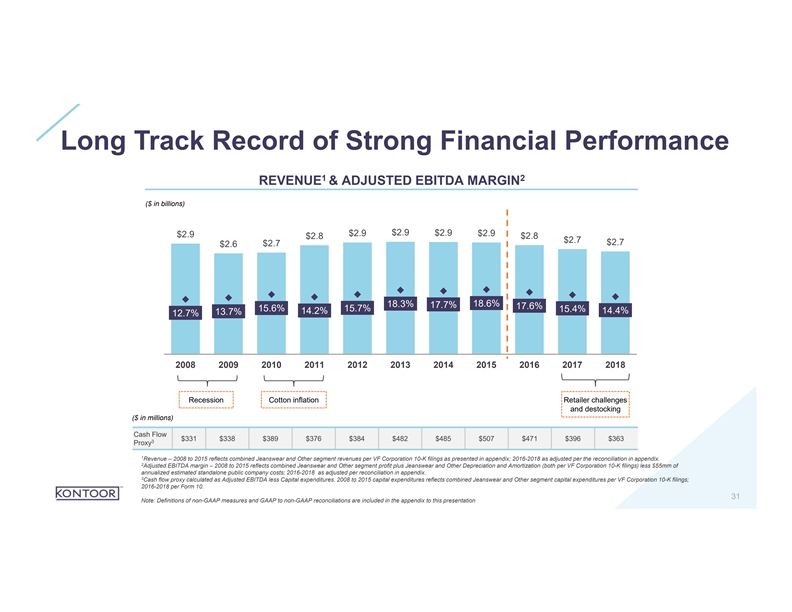
Long Track Record of Strong Financial Performance 1 2 REVENUE & ADJUSTED EBITDA MARGIN ($ in billions) $2.9 $2.9 $2.9 $2.9 $2.9 $2.8 $2.8 $2.7 $2.7 $2.7 $2.6 18.3% 18.6% 17.7% 17.6% 15.7% 15.6% 15.4% 14.2% 14.4% 13.7% 12.7% 2008 2009 2010 2011 2012 2013 2014 2015 2016 2017 2018 Recession Cotton inflation Retailer challenges and destocking ($ in millions) Cash Flow $331 $338 $389 $376 $384 $482 $485 $507 $471 $396 $363 3 Proxy 1 Revenue – 2008 to 2015 reflects combined Jeanswear and Other segment revenues per VF Corporation 10-K filings as presented in appendix; 2016-2018 as adjusted per the reconciliation in appendix. 2 Adjusted EBITDA margin – 2008 to 2015 reflects combined Jeanswear and Other segment profit plus Jeanswear and Other Depreciation and Amortization (both per VF Corporation 10-K filings) less $55mm of annualized estimated standalone public company costs; 2016-2018 as adjusted per reconciliation in appendix. 3 Cash flow proxy calculated as Adjusted EBITDA less Capital expenditures. 2008 to 2015 capital expenditures reflects combined Jeanswear and Other segment capital expenditures per VF Corporation 10-K filings; 2016-2018 per Form 10. 31 Note: Definitions of non-GAAP measures and GAAP to non-GAAP reconciliations are included in the appendix to this presentationLong Track Record of Strong Financial Performance 1 2 REVENUE & ADJUSTED EBITDA MARGIN ($ in billions) $2.9 $2.9 $2.9 $2.9 $2.9 $2.8 $2.8 $2.7 $2.7 $2.7 $2.6 18.3% 18.6% 17.7% 17.6% 15.7% 15.6% 15.4% 14.2% 14.4% 13.7% 12.7% 2008 2009 2010 2011 2012 2013 2014 2015 2016 2017 2018 Recession Cotton inflation Retailer challenges and destocking ($ in millions) Cash Flow $331 $338 $389 $376 $384 $482 $485 $507 $471 $396 $363 3 Proxy 1 Revenue – 2008 to 2015 reflects combined Jeanswear and Other segment revenues per VF Corporation 10-K filings as presented in appendix; 2016-2018 as adjusted per the reconciliation in appendix. 2 Adjusted EBITDA margin – 2008 to 2015 reflects combined Jeanswear and Other segment profit plus Jeanswear and Other Depreciation and Amortization (both per VF Corporation 10-K filings) less $55mm of annualized estimated standalone public company costs; 2016-2018 as adjusted per reconciliation in appendix. 3 Cash flow proxy calculated as Adjusted EBITDA less Capital expenditures. 2008 to 2015 capital expenditures reflects combined Jeanswear and Other segment capital expenditures per VF Corporation 10-K filings; 2016-2018 per Form 10. 31 Note: Definitions of non-GAAP measures and GAAP to non-GAAP reconciliations are included in the appendix to this presentation
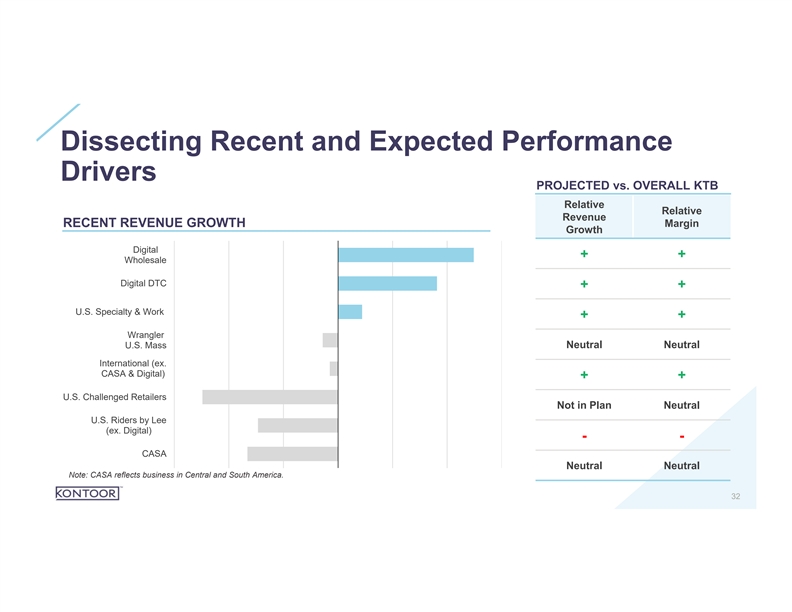
Dissecting Recent and Expected Performance Drivers PROJECTED vs. OVERALL KTB Relative Relative Revenue RECENT REVENUE GROWTH Margin Growth Digital ++ Wholesale Digital DTC ++ U.S. Specialty & Work ++ Wrangler U.S. Mass Neutral Neutral International (ex. CASA & Digital) ++ U.S. Challenged Retailers Not in Plan Neutral U.S. Riders by Lee (ex. Digital) -- CASA Neutral Neutral Note: CASA reflects business in Central and South America. 32Dissecting Recent and Expected Performance Drivers PROJECTED vs. OVERALL KTB Relative Relative Revenue RECENT REVENUE GROWTH Margin Growth Digital ++ Wholesale Digital DTC ++ U.S. Specialty & Work ++ Wrangler U.S. Mass Neutral Neutral International (ex. CASA & Digital) ++ U.S. Challenged Retailers Not in Plan Neutral U.S. Riders by Lee (ex. Digital) -- CASA Neutral Neutral Note: CASA reflects business in Central and South America. 32
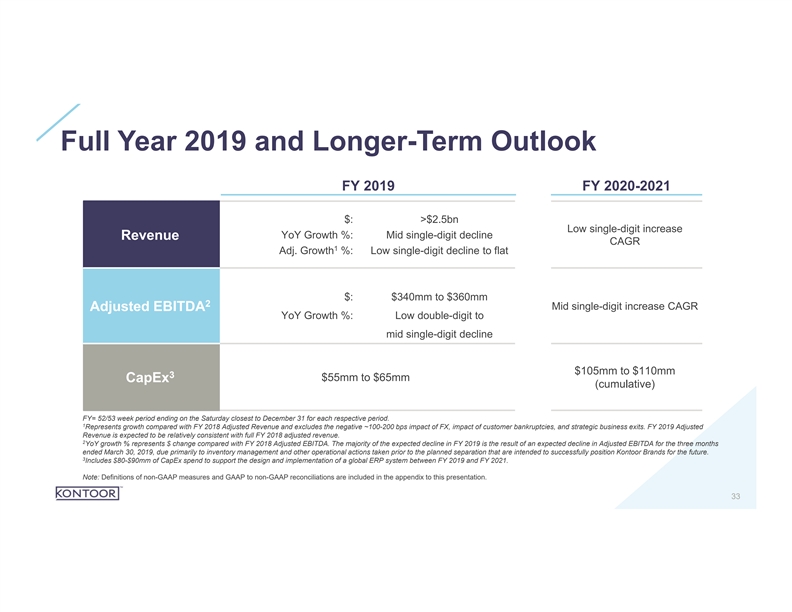
Full Year 2019 and Longer-Term Outlook FY 2019 FY 2020-2021 $: >$2.5bn Low single-digit increase YoY Growth %: Mid single-digit decline Revenue CAGR 1 Adj. Growth %: Low single-digit decline to flat $: $340mm to $360mm 2 Mid single-digit increase CAGR Adjusted EBITDA YoY Growth %: Low double-digit to mid single-digit decline $105mm to $110mm 3 $55mm to $65mm CapEx (cumulative) FY= 52/53 week period ending on the Saturday closest to December 31 for each respective period. 1 Represents growth compared with FY 2018 Adjusted Revenue and excludes the negative ~100-200 bps impact of FX, impact of customer bankruptcies, and strategic business exits. FY 2019 Adjusted Revenue is expected to be relatively consistent with full FY 2018 adjusted revenue. 2 YoY growth % represents $ change compared with FY 2018 Adjusted EBITDA. The majority of the expected decline in FY 2019 is the result of an expected decline in Adjusted EBITDA for the three months ended March 30, 2019, due primarily to inventory management and other operational actions taken prior to the planned separation that are intended to successfully position Kontoor Brands for the future. 3 Includes $80-$90mm of CapEx spend to support the design and implementation of a global ERP system between FY 2019 and FY 2021. Note: Definitions of non-GAAP measures and GAAP to non-GAAP reconciliations are included in the appendix to this presentation. 33Full Year 2019 and Longer-Term Outlook FY 2019 FY 2020-2021 $: >$2.5bn Low single-digit increase YoY Growth %: Mid single-digit decline Revenue CAGR 1 Adj. Growth %: Low single-digit decline to flat $: $340mm to $360mm 2 Mid single-digit increase CAGR Adjusted EBITDA YoY Growth %: Low double-digit to mid single-digit decline $105mm to $110mm 3 $55mm to $65mm CapEx (cumulative) FY= 52/53 week period ending on the Saturday closest to December 31 for each respective period. 1 Represents growth compared with FY 2018 Adjusted Revenue and excludes the negative ~100-200 bps impact of FX, impact of customer bankruptcies, and strategic business exits. FY 2019 Adjusted Revenue is expected to be relatively consistent with full FY 2018 adjusted revenue. 2 YoY growth % represents $ change compared with FY 2018 Adjusted EBITDA. The majority of the expected decline in FY 2019 is the result of an expected decline in Adjusted EBITDA for the three months ended March 30, 2019, due primarily to inventory management and other operational actions taken prior to the planned separation that are intended to successfully position Kontoor Brands for the future. 3 Includes $80-$90mm of CapEx spend to support the design and implementation of a global ERP system between FY 2019 and FY 2021. Note: Definitions of non-GAAP measures and GAAP to non-GAAP reconciliations are included in the appendix to this presentation. 33
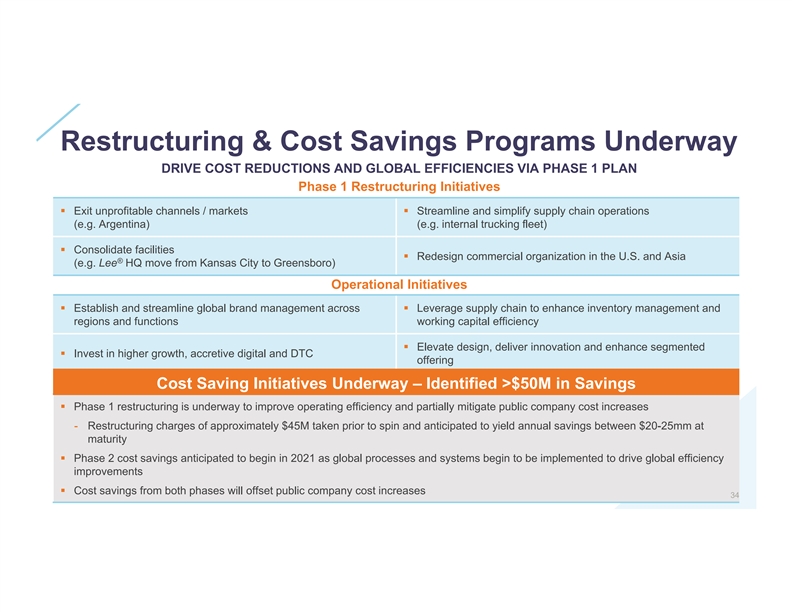
Restructuring & Cost Savings Programs Underway DRIVE COST REDUCTIONS AND GLOBAL EFFICIENCIES VIA PHASE 1 PLAN Phase 1 Restructuring Initiatives § Exit unprofitable channels / markets § Streamline and simplify supply chain operations (e.g. Argentina) (e.g. internal trucking fleet) § Consolidate facilities § Redesign commercial organization in the U.S. and Asia ® (e.g. Lee HQ move from Kansas City to Greensboro) Operational Initiatives § Establish and streamline global brand management across § Leverage supply chain to enhance inventory management and regions and functions working capital efficiency § Elevate design, deliver innovation and enhance segmented § Invest in higher growth, accretive digital and DTC offering Cost Saving Initiatives Underway – Identified >$50M in Savings § Phase 1 restructuring is underway to improve operating efficiency and partially mitigate public company cost increases - Restructuring charges of approximately $45M taken prior to spin and anticipated to yield annual savings between $20-25mm at maturity § Phase 2 cost savings anticipated to begin in 2021 as global processes and systems begin to be implemented to drive global efficiency improvements § Cost savings from both phases will offset public company cost increases 34Restructuring & Cost Savings Programs Underway DRIVE COST REDUCTIONS AND GLOBAL EFFICIENCIES VIA PHASE 1 PLAN Phase 1 Restructuring Initiatives § Exit unprofitable channels / markets § Streamline and simplify supply chain operations (e.g. Argentina) (e.g. internal trucking fleet) § Consolidate facilities § Redesign commercial organization in the U.S. and Asia ® (e.g. Lee HQ move from Kansas City to Greensboro) Operational Initiatives § Establish and streamline global brand management across § Leverage supply chain to enhance inventory management and regions and functions working capital efficiency § Elevate design, deliver innovation and enhance segmented § Invest in higher growth, accretive digital and DTC offering Cost Saving Initiatives Underway – Identified >$50M in Savings § Phase 1 restructuring is underway to improve operating efficiency and partially mitigate public company cost increases - Restructuring charges of approximately $45M taken prior to spin and anticipated to yield annual savings between $20-25mm at maturity § Phase 2 cost savings anticipated to begin in 2021 as global processes and systems begin to be implemented to drive global efficiency improvements § Cost savings from both phases will offset public company cost increases 34
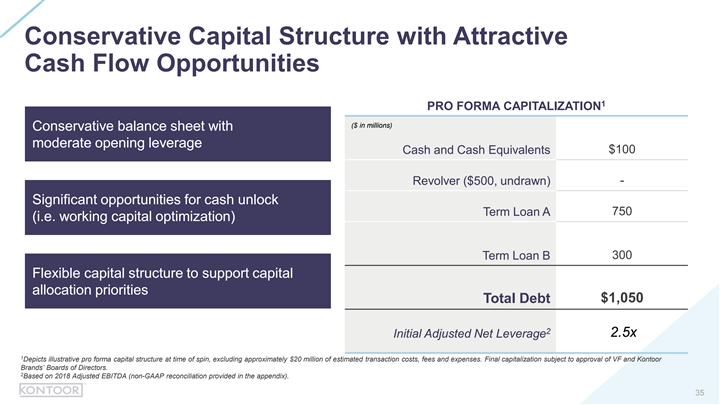
Conservative Capital Structure with Attractive Cash Flow Opportunities 1 PRO FORMA CAPITALIZATION ($ in millions) Conservative balance sheet with moderate opening leverage $100 Cash and Cash Equivalents - Revolver ($500, undrawn) Significant opportunities for cash unlock 750 Term Loan A (i.e. working capital optimization) 300 Term Loan B Flexible capital structure to support capital allocation priorities $1,050 Total Debt 2 2.5x Initial Adjusted Net Leverage 1 Depicts illustrative pro forma capital structure at time of spin, excluding approximately $20 million of estimated transaction costs, fees and expenses. Final capitalization subject to approval of VF and Kontoor Brands’ Boards of Directors. 2 Based on 2018 Adjusted EBITDA (non-GAAP reconciliation provided in the appendix). 35Conservative Capital Structure with Attractive Cash Flow Opportunities 1 PRO FORMA CAPITALIZATION ($ in millions) Conservative balance sheet with moderate opening leverage $100 Cash and Cash Equivalents - Revolver ($500, undrawn) Significant opportunities for cash unlock 750 Term Loan A (i.e. working capital optimization) 300 Term Loan B Flexible capital structure to support capital allocation priorities $1,050 Total Debt 2 2.5x Initial Adjusted Net Leverage 1 Depicts illustrative pro forma capital structure at time of spin, excluding approximately $20 million of estimated transaction costs, fees and expenses. Final capitalization subject to approval of VF and Kontoor Brands’ Boards of Directors. 2 Based on 2018 Adjusted EBITDA (non-GAAP reconciliation provided in the appendix). 35
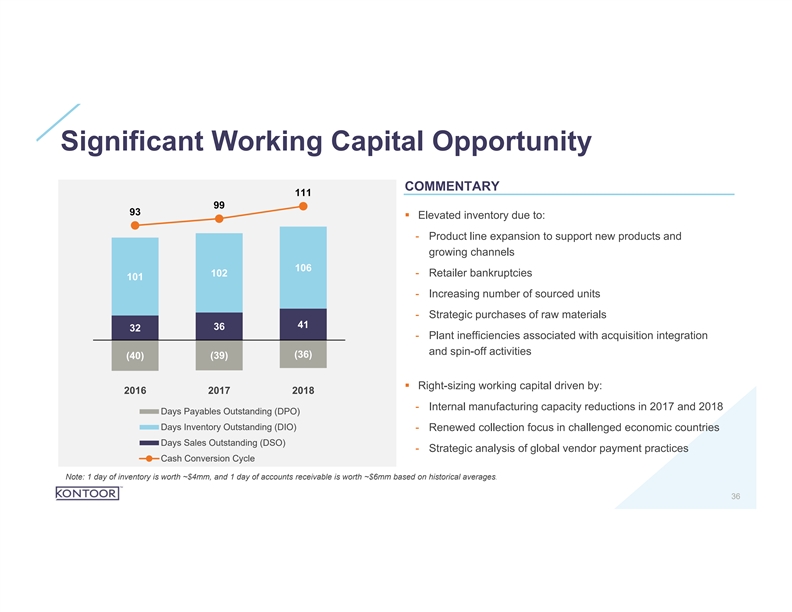
Significant Working Capital Opportunity 200 130 COMMENTARY 111 99 110 93 § Elevated inventory due to: 150 90 - Product line expansion to support new products and 70 growing channels 100 106 50 102 - Retailer bankruptcies 101 30 - Increasing number of sourced units 50 10 - Strategic purchases of raw materials 41 36 32 (10) - Plant inefficiencies associated with acquisition integration 0 and spin-off activities (36) (40) (39) (30) (50) (50) § Right-sizing working capital driven by: 2016 2017 2018 - Internal manufacturing capacity reductions in 2017 and 2018 Days Payables Outstanding (DPO) Days Inventory Outstanding (DIO) - Renewed collection focus in challenged economic countries Days Sales Outstanding (DSO) - Strategic analysis of global vendor payment practices Cash Conversion Cycle Note: 1 day of inventory is worth ~$4mm, and 1 day of accounts receivable is worth ~$6mm based on historical averages. 36Significant Working Capital Opportunity 200 130 COMMENTARY 111 99 110 93 § Elevated inventory due to: 150 90 - Product line expansion to support new products and 70 growing channels 100 106 50 102 - Retailer bankruptcies 101 30 - Increasing number of sourced units 50 10 - Strategic purchases of raw materials 41 36 32 (10) - Plant inefficiencies associated with acquisition integration 0 and spin-off activities (36) (40) (39) (30) (50) (50) § Right-sizing working capital driven by: 2016 2017 2018 - Internal manufacturing capacity reductions in 2017 and 2018 Days Payables Outstanding (DPO) Days Inventory Outstanding (DIO) - Renewed collection focus in challenged economic countries Days Sales Outstanding (DSO) - Strategic analysis of global vendor payment practices Cash Conversion Cycle Note: 1 day of inventory is worth ~$4mm, and 1 day of accounts receivable is worth ~$6mm based on historical averages. 36

Kontoor is an Attractive Investment Opportunity STRONG FINANCIAL MODEL SHAREHOLDER-FOCUSED CAPITAL DEPLOYMENT Strong dividend policy Compelling, durable & consistent cash flow Compelling dividend yield funded by >$300M in annual operating cash flows 60% target payout Committed to a healthy balance sheet Healthy margin expansion 1 Long-term adjusted gross leverage target of <3x Identified >$50 million in cost reductions Focused deployment of excess free cash flow Sustainable growth Attractive dividend yield, de-lever debt and consider Profitable, low single digit growth attractive future growth opportunities SOURCES OF ADVANTAGE Two iconic brands | VF DNA | Supply chain excellence | Strong relationships with winning retailers | Experienced management team 1 Definitions of non-GAAP measures and GAAP to non-GAAP reconciliations are included in the appendix to this presentation. 37Kontoor is an Attractive Investment Opportunity STRONG FINANCIAL MODEL SHAREHOLDER-FOCUSED CAPITAL DEPLOYMENT Strong dividend policy Compelling, durable & consistent cash flow Compelling dividend yield funded by >$300M in annual operating cash flows 60% target payout Committed to a healthy balance sheet Healthy margin expansion 1 Long-term adjusted gross leverage target of <3x Identified >$50 million in cost reductions Focused deployment of excess free cash flow Sustainable growth Attractive dividend yield, de-lever debt and consider Profitable, low single digit growth attractive future growth opportunities SOURCES OF ADVANTAGE Two iconic brands | VF DNA | Supply chain excellence | Strong relationships with winning retailers | Experienced management team 1 Definitions of non-GAAP measures and GAAP to non-GAAP reconciliations are included in the appendix to this presentation. 37

Questions & Discussions 38Questions & Discussions 38

Appendix 39Appendix 39
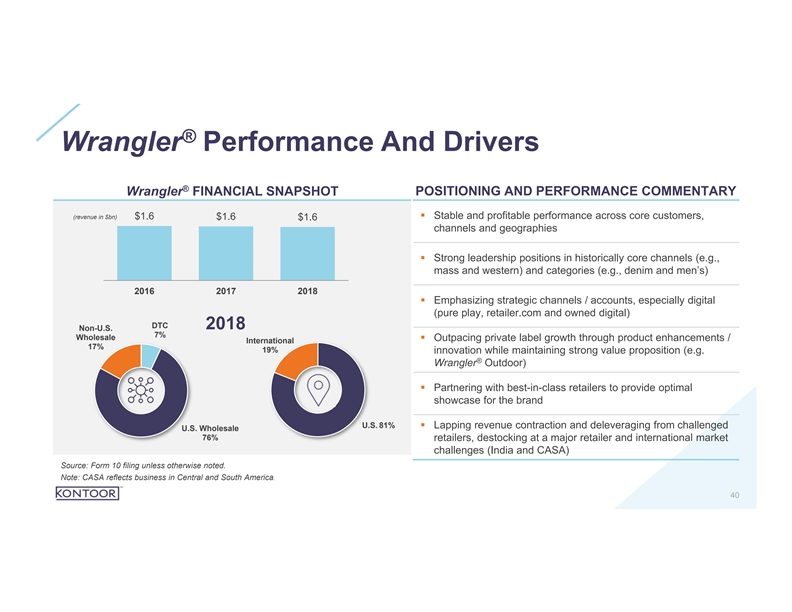
® Wrangler Performance And Drivers ® Wrangler FINANCIAL SNAPSHOT POSITIONING AND PERFORMANCE COMMENTARY (revenue in $bn)§ Stable and profitable performance across core customers, $1.6 $1.6 $1.6 channels and geographies § Strong leadership positions in historically core channels (e.g., mass and western) and categories (e.g., denim and men’s) 2016 2017 2018 § Emphasizing strategic channels / accounts, especially digital (pure play, retailer.com and owned digital) DTC 2018 Non-U.S. 7% Wholesale § Outpacing private label growth through product enhancements / International 17% 19% innovation while maintaining strong value proposition (e.g. ® Wrangler Outdoor) § Partnering with best-in-class retailers to provide optimal showcase for the brand U.S. 81% § Lapping revenue contraction and deleveraging from challenged U.S. Wholesale 76% retailers, destocking at a major retailer and international market challenges (India and CASA) Source: Form 10 filing unless otherwise noted. Note: CASA reflects business in Central and South America. 40® Wrangler Performance And Drivers ® Wrangler FINANCIAL SNAPSHOT POSITIONING AND PERFORMANCE COMMENTARY (revenue in $bn)§ Stable and profitable performance across core customers, $1.6 $1.6 $1.6 channels and geographies § Strong leadership positions in historically core channels (e.g., mass and western) and categories (e.g., denim and men’s) 2016 2017 2018 § Emphasizing strategic channels / accounts, especially digital (pure play, retailer.com and owned digital) DTC 2018 Non-U.S. 7% Wholesale § Outpacing private label growth through product enhancements / International 17% 19% innovation while maintaining strong value proposition (e.g. ® Wrangler Outdoor) § Partnering with best-in-class retailers to provide optimal showcase for the brand U.S. 81% § Lapping revenue contraction and deleveraging from challenged U.S. Wholesale 76% retailers, destocking at a major retailer and international market challenges (India and CASA) Source: Form 10 filing unless otherwise noted. Note: CASA reflects business in Central and South America. 40
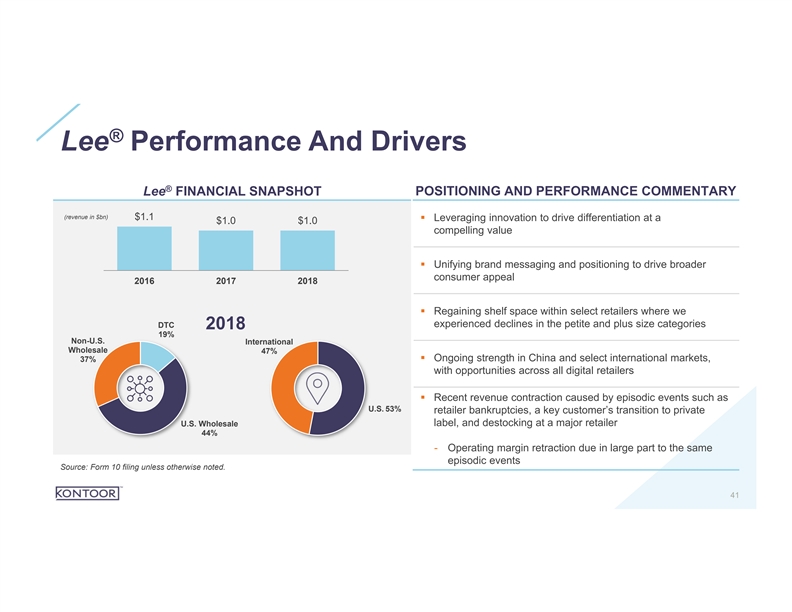
® Lee Performance And Drivers ® Lee FINANCIAL SNAPSHOT POSITIONING AND PERFORMANCE COMMENTARY (revenue in $bn) $1.1 § Leveraging innovation to drive differentiation at a $1.0 $1.0 compelling value § Unifying brand messaging and positioning to drive broader consumer appeal 2016 2017 2018 § Regaining shelf space within select retailers where we experienced declines in the petite and plus size categories DTC 2018 19% Non-U.S. International Wholesale 47% § Ongoing strength in China and select international markets, 37% with opportunities across all digital retailers § Recent revenue contraction caused by episodic events such as U.S. 53% retailer bankruptcies, a key customer’s transition to private label, and destocking at a major retailer U.S. Wholesale 44% - Operating margin retraction due in large part to the same episodic events Source: Form 10 filing unless otherwise noted. 41® Lee Performance And Drivers ® Lee FINANCIAL SNAPSHOT POSITIONING AND PERFORMANCE COMMENTARY (revenue in $bn) $1.1 § Leveraging innovation to drive differentiation at a $1.0 $1.0 compelling value § Unifying brand messaging and positioning to drive broader consumer appeal 2016 2017 2018 § Regaining shelf space within select retailers where we experienced declines in the petite and plus size categories DTC 2018 19% Non-U.S. International Wholesale 47% § Ongoing strength in China and select international markets, 37% with opportunities across all digital retailers § Recent revenue contraction caused by episodic events such as U.S. 53% retailer bankruptcies, a key customer’s transition to private label, and destocking at a major retailer U.S. Wholesale 44% - Operating margin retraction due in large part to the same episodic events Source: Form 10 filing unless otherwise noted. 41
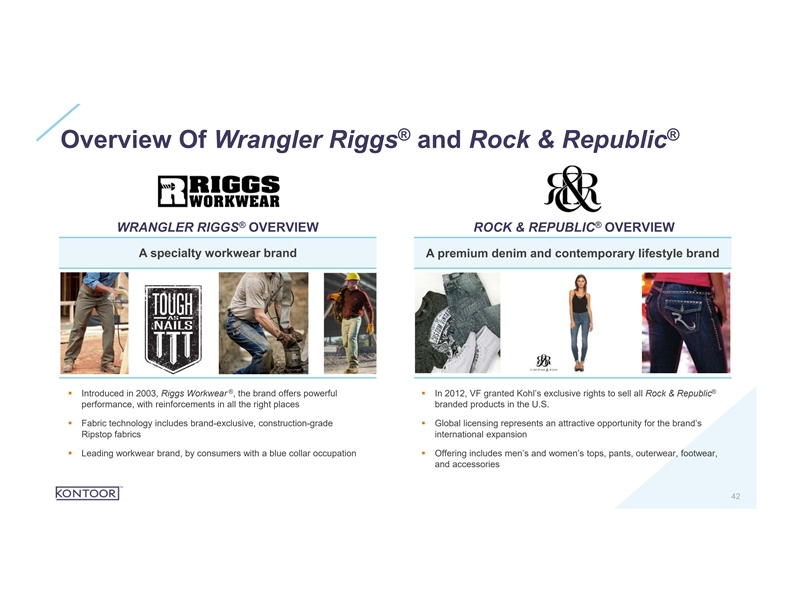
® ® Overview Of Wrangler Riggs and Rock & Republic ® ® WRANGLER RIGGS OVERVIEW ROCK & REPUBLIC OVERVIEW A specialty workwear brand A premium denim and contemporary lifestyle brand ® ® § Introduced in 2003, Riggs Workwear , the brand offers powerful § In 2012, VF granted Kohl’s exclusive rights to sell all Rock & Republic performance, with reinforcements in all the right places branded products in the U.S. § Fabric technology includes brand-exclusive, construction-grade § Global licensing represents an attractive opportunity for the brand’s Ripstop fabrics international expansion § Leading workwear brand, by consumers with a blue collar occupation § Offering includes men’s and women’s tops, pants, outerwear, footwear, and accessories 42® ® Overview Of Wrangler Riggs and Rock & Republic ® ® WRANGLER RIGGS OVERVIEW ROCK & REPUBLIC OVERVIEW A specialty workwear brand A premium denim and contemporary lifestyle brand ® ® § Introduced in 2003, Riggs Workwear , the brand offers powerful § In 2012, VF granted Kohl’s exclusive rights to sell all Rock & Republic performance, with reinforcements in all the right places branded products in the U.S. § Fabric technology includes brand-exclusive, construction-grade § Global licensing represents an attractive opportunity for the brand’s Ripstop fabrics international expansion § Leading workwear brand, by consumers with a blue collar occupation § Offering includes men’s and women’s tops, pants, outerwear, footwear, and accessories 42
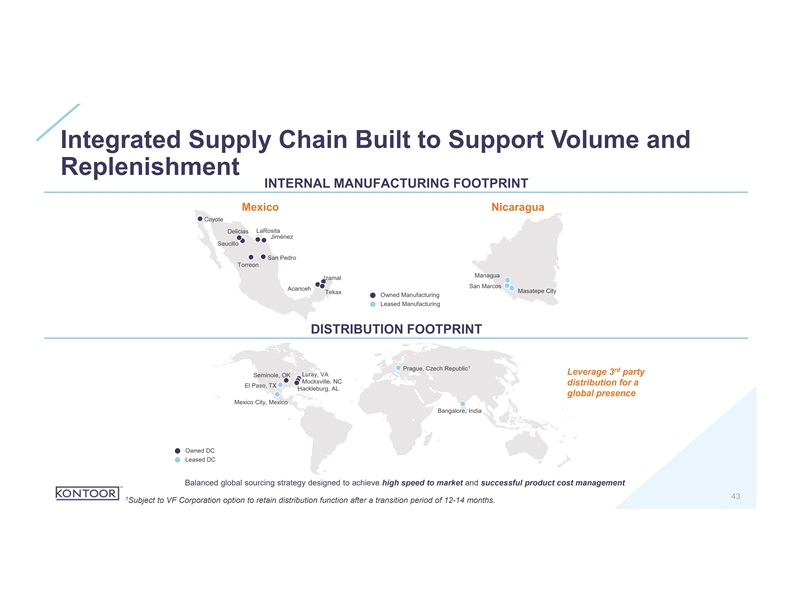
Integrated Supply Chain Built to Support Volume and Replenishment INTERNAL MANUFACTURING FOOTPRINT Mexico Nicaragua Coyote LaRosita Delicias Jiménez Saucillo San Pedro Torreon Managua Izamal San Marcos Acanceh Masatepe City Tekax Owned Manufacturing Leased Manufacturing DISTRIBUTION FOOTPRINT 1 Prague, Czech Republic rd Leverage 3 party Seminole, OK Luray, VA Mocksville, NC distribution for a El Paso, TX Hackleburg, AL global presence Mexico City, Mexico Bangalore, India Owned DC Leased DC Balanced global sourcing strategy designed to achieve high speed to market and successful product cost management 43 1 Subject to VF Corporation option to retain distribution function after a transition period of 12-14 months. Integrated Supply Chain Built to Support Volume and Replenishment INTERNAL MANUFACTURING FOOTPRINT Mexico Nicaragua Coyote LaRosita Delicias Jiménez Saucillo San Pedro Torreon Managua Izamal San Marcos Acanceh Masatepe City Tekax Owned Manufacturing Leased Manufacturing DISTRIBUTION FOOTPRINT 1 Prague, Czech Republic rd Leverage 3 party Seminole, OK Luray, VA Mocksville, NC distribution for a El Paso, TX Hackleburg, AL global presence Mexico City, Mexico Bangalore, India Owned DC Leased DC Balanced global sourcing strategy designed to achieve high speed to market and successful product cost management 43 1 Subject to VF Corporation option to retain distribution function after a transition period of 12-14 months.
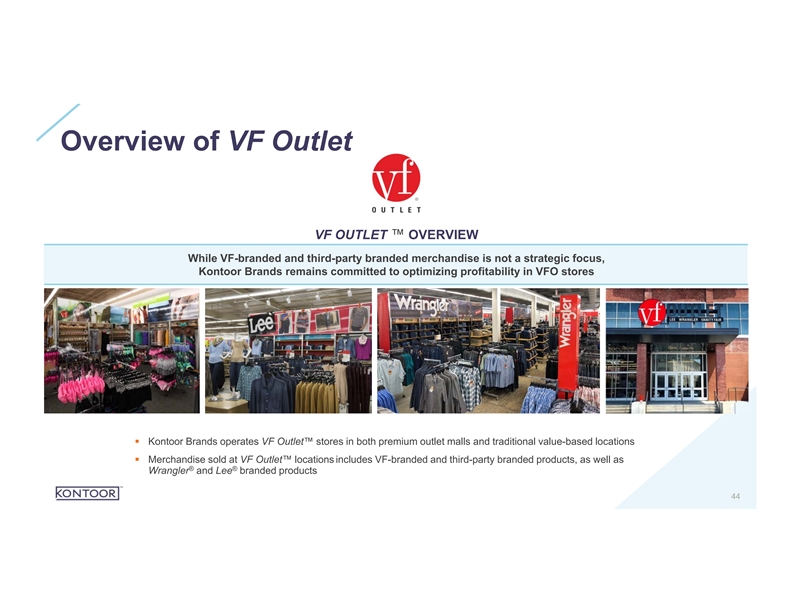
Overview of VF Outlet VF OUTLET ™ OVERVIEW While VF-branded and third-party branded merchandise is not a strategic focus, Kontoor Brands remains committed to optimizing profitability in VFO stores § Kontoor Brands operates VF Outlet™ stores in both premium outlet malls and traditional value-based locations § Merchandise sold at VF Outlet™ locations includes VF-branded and third-party branded products, as well as ® ® Wrangler and Lee branded products 44Overview of VF Outlet VF OUTLET ™ OVERVIEW While VF-branded and third-party branded merchandise is not a strategic focus, Kontoor Brands remains committed to optimizing profitability in VFO stores § Kontoor Brands operates VF Outlet™ stores in both premium outlet malls and traditional value-based locations § Merchandise sold at VF Outlet™ locations includes VF-branded and third-party branded products, as well as ® ® Wrangler and Lee branded products 44
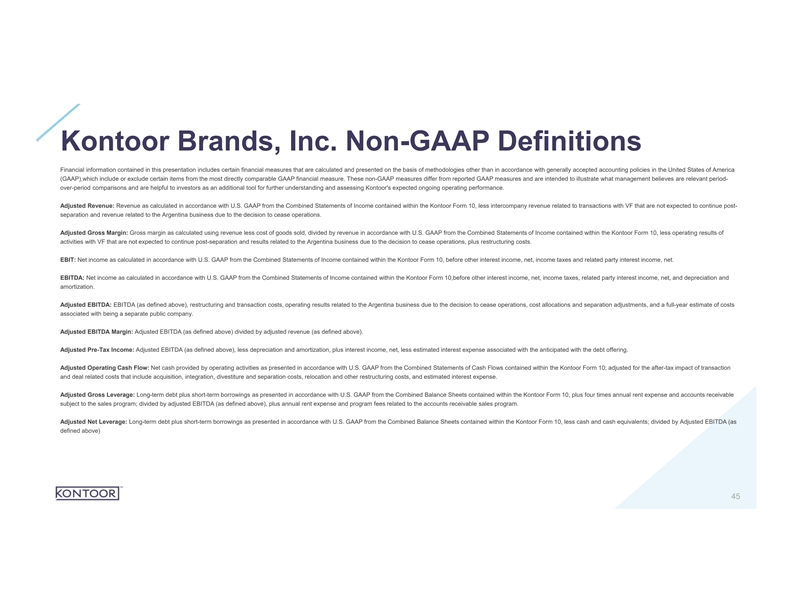
Kontoor Brands, Inc. Non-GAAP Definitions Financial information contained in this presentation includes certain financial measures that are calculated and presented on the basis of methodologies other than in accordance with generally accepted accounting policies in the United States of America (GAAP),which include or exclude certain items from the most directly comparable GAAP financial measure. These non-GAAP measures differ from reported GAAP measures and are intended to illustrate what management believes are relevant period- over-period comparisons and are helpful to investors as an additional tool for further understanding and assessing Kontoor's expected ongoing operating performance. Adjusted Revenue: Revenue as calculated in accordance with U.S. GAAP from the Combined Statements of Income contained within the Kontoor Form 10, less intercompany revenue related to transactions with VF that are not expected to continue post- separation and revenue related to the Argentina business due to the decision to cease operations. Adjusted Gross Margin: Gross margin as calculated using revenue less cost of goods sold, divided by revenue in accordance with U.S. GAAP from the Combined Statements of Income contained within the Kontoor Form 10, less operating results of activities with VF that are not expected to continue post-separation and results related to the Argentina business due to the decision to cease operations, plus restructuring costs. EBIT: Net income as calculated in accordance with U.S. GAAP from the Combined Statements of Income contained within the Kontoor Form 10, before other interest income, net, income taxes and related party interest income, net. EBITDA: Net income as calculated in accordance with U.S. GAAP from the Combined Statements of Income contained within the Kontoor Form 10,before other interest income, net, income taxes, related party interest income, net, and depreciation and amortization. Adjusted EBITDA: EBITDA (as defined above), restructuring and transaction costs, operating results related to the Argentina business due to the decision to cease operations, cost allocations and separation adjustments, and a full-year estimate of costs associated with being a separate public company. Adjusted EBITDA Margin: Adjusted EBITDA (as defined above) divided by adjusted revenue (as defined above). Adjusted Pre-Tax Income: Adjusted EBITDA (as defined above), less depreciation and amortization, plus interest income, net, less estimated interest expense associated with the anticipated with the debt offering. Adjusted Operating Cash Flow: Net cash provided by operating activities as presented in accordance with U.S. GAAP from the Combined Statements of Cash Flows contained within the Kontoor Form 10; adjusted for the after-tax impact of transaction and deal related costs that include acquisition, integration, divestiture and separation costs, relocation and other restructuring costs, and estimated interest expense. Adjusted Gross Leverage: Long-term debt plus short-term borrowings as presented in accordance with U.S. GAAP from the Combined Balance Sheets contained within the Kontoor Form 10, plus four times annual rent expense and accounts receivable subject to the sales program; divided by adjusted EBITDA (as defined above), plus annual rent expense and program fees related to the accounts receivable sales program. Adjusted Net Leverage: Long-term debt plus short-term borrowings as presented in accordance with U.S. GAAP from the Combined Balance Sheets contained within the Kontoor Form 10, less cash and cash equivalents; divided by Adjusted EBITDA (as defined above) 45Kontoor Brands, Inc. Non-GAAP Definitions Financial information contained in this presentation includes certain financial measures that are calculated and presented on the basis of methodologies other than in accordance with generally accepted accounting policies in the United States of America (GAAP),which include or exclude certain items from the most directly comparable GAAP financial measure. These non-GAAP measures differ from reported GAAP measures and are intended to illustrate what management believes are relevant period- over-period comparisons and are helpful to investors as an additional tool for further understanding and assessing Kontoor's expected ongoing operating performance. Adjusted Revenue: Revenue as calculated in accordance with U.S. GAAP from the Combined Statements of Income contained within the Kontoor Form 10, less intercompany revenue related to transactions with VF that are not expected to continue post- separation and revenue related to the Argentina business due to the decision to cease operations. Adjusted Gross Margin: Gross margin as calculated using revenue less cost of goods sold, divided by revenue in accordance with U.S. GAAP from the Combined Statements of Income contained within the Kontoor Form 10, less operating results of activities with VF that are not expected to continue post-separation and results related to the Argentina business due to the decision to cease operations, plus restructuring costs. EBIT: Net income as calculated in accordance with U.S. GAAP from the Combined Statements of Income contained within the Kontoor Form 10, before other interest income, net, income taxes and related party interest income, net. EBITDA: Net income as calculated in accordance with U.S. GAAP from the Combined Statements of Income contained within the Kontoor Form 10,before other interest income, net, income taxes, related party interest income, net, and depreciation and amortization. Adjusted EBITDA: EBITDA (as defined above), restructuring and transaction costs, operating results related to the Argentina business due to the decision to cease operations, cost allocations and separation adjustments, and a full-year estimate of costs associated with being a separate public company. Adjusted EBITDA Margin: Adjusted EBITDA (as defined above) divided by adjusted revenue (as defined above). Adjusted Pre-Tax Income: Adjusted EBITDA (as defined above), less depreciation and amortization, plus interest income, net, less estimated interest expense associated with the anticipated with the debt offering. Adjusted Operating Cash Flow: Net cash provided by operating activities as presented in accordance with U.S. GAAP from the Combined Statements of Cash Flows contained within the Kontoor Form 10; adjusted for the after-tax impact of transaction and deal related costs that include acquisition, integration, divestiture and separation costs, relocation and other restructuring costs, and estimated interest expense. Adjusted Gross Leverage: Long-term debt plus short-term borrowings as presented in accordance with U.S. GAAP from the Combined Balance Sheets contained within the Kontoor Form 10, plus four times annual rent expense and accounts receivable subject to the sales program; divided by adjusted EBITDA (as defined above), plus annual rent expense and program fees related to the accounts receivable sales program. Adjusted Net Leverage: Long-term debt plus short-term borrowings as presented in accordance with U.S. GAAP from the Combined Balance Sheets contained within the Kontoor Form 10, less cash and cash equivalents; divided by Adjusted EBITDA (as defined above) 45
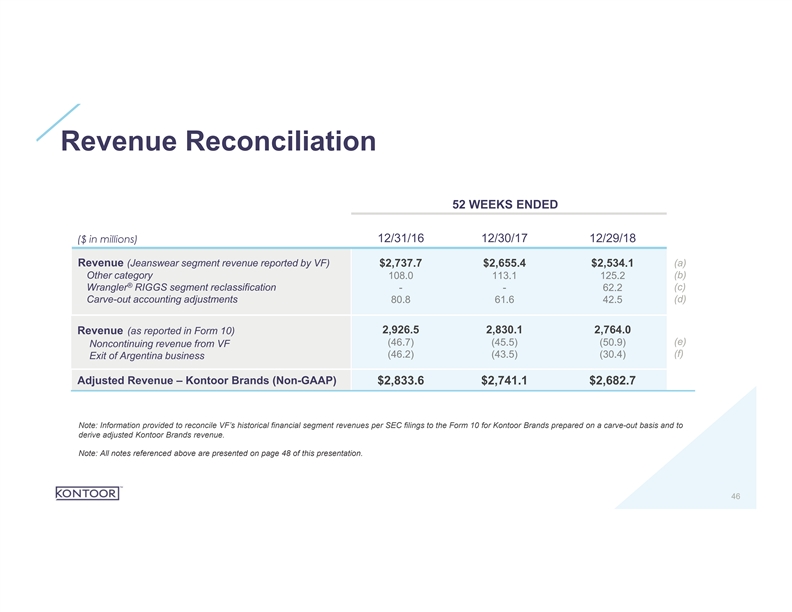
Revenue Reconciliation 52 WEEKS ENDED 12/31/16 12/30/17 12/29/18 ($ in millions) Revenue (Jeanswear segment revenue reported by VF) (a) $2,737.7 $2,655.4 $2,534.1 (b) Other category 108.0 113.1 125.2 ® (c) Wrangler RIGGS segment reclassification - - 62.2 (d) Carve-out accounting adjustments 80.8 61.6 42.5 2,926.5 2,830.1 2,764.0 Revenue (as reported in Form 10) (e) (46.7) (45.5) (50.9) Noncontinuing revenue from VF (f) (46.2) (43.5) (30.4) Exit of Argentina business Adjusted Revenue – Kontoor Brands (Non-GAAP) $2,833.6 $2,741.1 $2,682.7 Note: Information provided to reconcile VF’s historical financial segment revenues per SEC filings to the Form 10 for Kontoor Brands prepared on a carve-out basis and to derive adjusted Kontoor Brands revenue. Note: All notes referenced above are presented on page 48 of this presentation. 46Revenue Reconciliation 52 WEEKS ENDED 12/31/16 12/30/17 12/29/18 ($ in millions) Revenue (Jeanswear segment revenue reported by VF) (a) $2,737.7 $2,655.4 $2,534.1 (b) Other category 108.0 113.1 125.2 ® (c) Wrangler RIGGS segment reclassification - - 62.2 (d) Carve-out accounting adjustments 80.8 61.6 42.5 2,926.5 2,830.1 2,764.0 Revenue (as reported in Form 10) (e) (46.7) (45.5) (50.9) Noncontinuing revenue from VF (f) (46.2) (43.5) (30.4) Exit of Argentina business Adjusted Revenue – Kontoor Brands (Non-GAAP) $2,833.6 $2,741.1 $2,682.7 Note: Information provided to reconcile VF’s historical financial segment revenues per SEC filings to the Form 10 for Kontoor Brands prepared on a carve-out basis and to derive adjusted Kontoor Brands revenue. Note: All notes referenced above are presented on page 48 of this presentation. 46
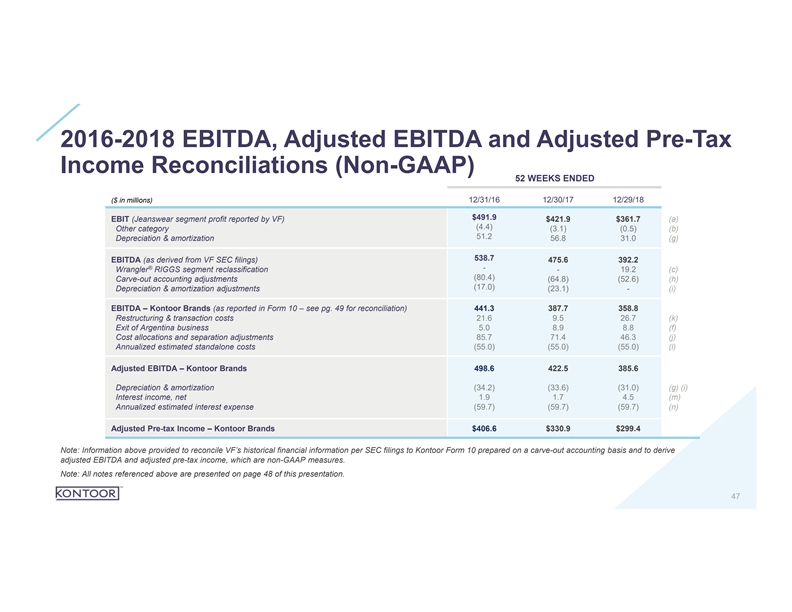
2016-2018 EBITDA, Adjusted EBITDA and Adjusted Pre-Tax Income Reconciliations (Non-GAAP) 52 WEEKS ENDED ($ in millions) 12/31/16 12/30/17 12/29/18 $491.9 EBIT (Jeanswear segment profit reported by VF) $421.9 $361.7 (a) (4.4) Other category (3.1) (0.5) (b) 51.2 Depreciation & amortization 56.8 31.0 (g) 538.7 EBITDA (as derived from VF SEC filings) 475.6 392.2 ® - Wrangler RIGGS segment reclassification - 19.2 (c) (80.4) Carve-out accounting adjustments (64.8) (52.6) (h) (17.0) Depreciation & amortization adjustments (23.1) - (i) EBITDA – Kontoor Brands (as reported in Form 10 – see pg. 49 for reconciliation) 441.3 387.7 358.8 Restructuring & transaction costs 21.6 9.5 26.7 (k) Exit of Argentina business 5.0 8.9 8.8 (f) Cost allocations and separation adjustments 85.7 71.4 46.3 (j) Annualized estimated standalone costs (55.0) (55.0) (55.0) (l) Adjusted EBITDA – Kontoor Brands 498.6 422.5 385.6 Depreciation & amortization (34.2) (33.6) (31.0) (g) (i) Interest income, net 1.9 1.7 4.5 (m) Annualized estimated interest expense (59.7) (59.7) (59.7) (n) Adjusted Pre-tax Income – Kontoor Brands $406.6 $330.9 $299.4 Note: Information above provided to reconcile VF’s historical financial information per SEC filings to Kontoor Form 10 prepared on a carve-out accounting basis and to derive adjusted EBITDA and adjusted pre-tax income, which are non-GAAP measures. Note: All notes referenced above are presented on page 48 of this presentation. 472016-2018 EBITDA, Adjusted EBITDA and Adjusted Pre-Tax Income Reconciliations (Non-GAAP) 52 WEEKS ENDED ($ in millions) 12/31/16 12/30/17 12/29/18 $491.9 EBIT (Jeanswear segment profit reported by VF) $421.9 $361.7 (a) (4.4) Other category (3.1) (0.5) (b) 51.2 Depreciation & amortization 56.8 31.0 (g) 538.7 EBITDA (as derived from VF SEC filings) 475.6 392.2 ® - Wrangler RIGGS segment reclassification - 19.2 (c) (80.4) Carve-out accounting adjustments (64.8) (52.6) (h) (17.0) Depreciation & amortization adjustments (23.1) - (i) EBITDA – Kontoor Brands (as reported in Form 10 – see pg. 49 for reconciliation) 441.3 387.7 358.8 Restructuring & transaction costs 21.6 9.5 26.7 (k) Exit of Argentina business 5.0 8.9 8.8 (f) Cost allocations and separation adjustments 85.7 71.4 46.3 (j) Annualized estimated standalone costs (55.0) (55.0) (55.0) (l) Adjusted EBITDA – Kontoor Brands 498.6 422.5 385.6 Depreciation & amortization (34.2) (33.6) (31.0) (g) (i) Interest income, net 1.9 1.7 4.5 (m) Annualized estimated interest expense (59.7) (59.7) (59.7) (n) Adjusted Pre-tax Income – Kontoor Brands $406.6 $330.9 $299.4 Note: Information above provided to reconcile VF’s historical financial information per SEC filings to Kontoor Form 10 prepared on a carve-out accounting basis and to derive adjusted EBITDA and adjusted pre-tax income, which are non-GAAP measures. Note: All notes referenced above are presented on page 48 of this presentation. 47
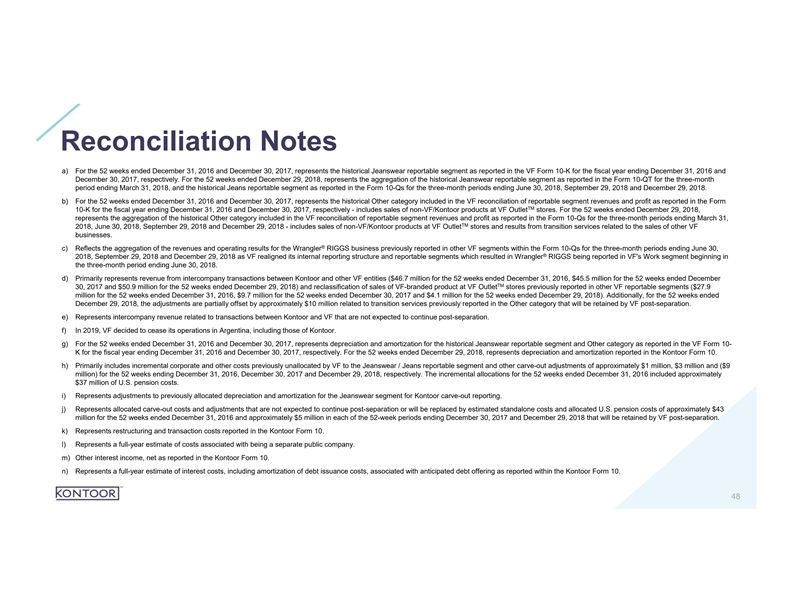
Reconciliation Notes a) For the 52 weeks ended December 31, 2016 and December 30, 2017, represents the historical Jeanswear reportable segment as reported in the VF Form 10-K for the fiscal year ending December 31, 2016 and December 30, 2017, respectively. For the 52 weeks ended December 29, 2018, represents the aggregation of the historical Jeanswear reportable segment as reported in the Form 10-QT for the three-month period ending March 31, 2018, and the historical Jeans reportable segment as reported in the Form 10-Qs for the three-month periods ending June 30, 2018, September 29, 2018 and December 29, 2018. b) For the 52 weeks ended December 31, 2016 and December 30, 2017, represents the historical Other category included in the VF reconciliation of reportable segment revenues and profit as reported in the Form TM 10-K for the fiscal year ending December 31, 2016 and December 30, 2017, respectively - includes sales of non-VF/Kontoor products at VF Outlet stores. For the 52 weeks ended December 29, 2018, represents the aggregation of the historical Other category included in the VF reconciliation of reportable segment revenues and profit as reported in the Form 10-Qs for the three-month periods ending March 31, TM 2018, June 30, 2018, September 29, 2018 and December 29, 2018 - includes sales of non-VF/Kontoor products at VF Outlet stores and results from transition services related to the sales of other VF businesses. ® c) Reflects the aggregation of the revenues and operating results for the Wrangler RIGGS business previously reported in other VF segments within the Form 10-Qs for the three-month periods ending June 30, ® 2018, September 29, 2018 and December 29, 2018 as VF realigned its internal reporting structure and reportable segments which resulted in Wrangler RIGGS being reported in VF's Work segment beginning in the three-month period ending June 30, 2018. d) Primarily represents revenue from intercompany transactions between Kontoor and other VF entities ($46.7 million for the 52 weeks ended December 31, 2016, $45.5 million for the 52 weeks ended December TM 30, 2017 and $50.9 million for the 52 weeks ended December 29, 2018) and reclassification of sales of VF-branded product at VF Outlet stores previously reported in other VF reportable segments ($27.9 million for the 52 weeks ended December 31, 2016, $9.7 million for the 52 weeks ended December 30, 2017 and $4.1 million for the 52 weeks ended December 29, 2018). Additionally, for the 52 weeks ended December 29, 2018, the adjustments are partially offset by approximately $10 million related to transition services previously reported in the Other category that will be retained by VF post-separation. e) Represents intercompany revenue related to transactions between Kontoor and VF that are not expected to continue post-separation. f) In 2019, VF decided to cease its operations in Argentina, including those of Kontoor. g) For the 52 weeks ended December 31, 2016 and December 30, 2017, represents depreciation and amortization for the historical Jeanswear reportable segment and Other category as reported in the VF Form 10- K for the fiscal year ending December 31, 2016 and December 30, 2017, respectively. For the 52 weeks ended December 29, 2018, represents depreciation and amortization reported in the Kontoor Form 10. h) Primarily includes incremental corporate and other costs previously unallocated by VF to the Jeanswear / Jeans reportable segment and other carve-out adjustments of approximately $1 million, $3 million and ($9 million) for the 52 weeks ending December 31, 2016, December 30, 2017 and December 29, 2018, respectively. The incremental allocations for the 52 weeks ended December 31, 2016 included approximately $37 million of U.S. pension costs. i) Represents adjustments to previously allocated depreciation and amortization for the Jeanswear segment for Kontoor carve-out reporting. j) Represents allocated carve-out costs and adjustments that are not expected to continue post-separation or will be replaced by estimated standalone costs and allocated U.S. pension costs of approximately $43 million for the 52 weeks ended December 31, 2016 and approximately $5 million in each of the 52-week periods ending December 30, 2017 and December 29, 2018 that will be retained by VF post-separation. k) Represents restructuring and transaction costs reported in the Kontoor Form 10. l) Represents a full-year estimate of costs associated with being a separate public company. m) Other interest income, net as reported in the Kontoor Form 10. n) Represents a full-year estimate of interest costs, including amortization of debt issuance costs, associated with anticipated debt offering as reported within the Kontoor Form 10. 48Reconciliation Notes a) For the 52 weeks ended December 31, 2016 and December 30, 2017, represents the historical Jeanswear reportable segment as reported in the VF Form 10-K for the fiscal year ending December 31, 2016 and December 30, 2017, respectively. For the 52 weeks ended December 29, 2018, represents the aggregation of the historical Jeanswear reportable segment as reported in the Form 10-QT for the three-month period ending March 31, 2018, and the historical Jeans reportable segment as reported in the Form 10-Qs for the three-month periods ending June 30, 2018, September 29, 2018 and December 29, 2018. b) For the 52 weeks ended December 31, 2016 and December 30, 2017, represents the historical Other category included in the VF reconciliation of reportable segment revenues and profit as reported in the Form TM 10-K for the fiscal year ending December 31, 2016 and December 30, 2017, respectively - includes sales of non-VF/Kontoor products at VF Outlet stores. For the 52 weeks ended December 29, 2018, represents the aggregation of the historical Other category included in the VF reconciliation of reportable segment revenues and profit as reported in the Form 10-Qs for the three-month periods ending March 31, TM 2018, June 30, 2018, September 29, 2018 and December 29, 2018 - includes sales of non-VF/Kontoor products at VF Outlet stores and results from transition services related to the sales of other VF businesses. ® c) Reflects the aggregation of the revenues and operating results for the Wrangler RIGGS business previously reported in other VF segments within the Form 10-Qs for the three-month periods ending June 30, ® 2018, September 29, 2018 and December 29, 2018 as VF realigned its internal reporting structure and reportable segments which resulted in Wrangler RIGGS being reported in VF's Work segment beginning in the three-month period ending June 30, 2018. d) Primarily represents revenue from intercompany transactions between Kontoor and other VF entities ($46.7 million for the 52 weeks ended December 31, 2016, $45.5 million for the 52 weeks ended December TM 30, 2017 and $50.9 million for the 52 weeks ended December 29, 2018) and reclassification of sales of VF-branded product at VF Outlet stores previously reported in other VF reportable segments ($27.9 million for the 52 weeks ended December 31, 2016, $9.7 million for the 52 weeks ended December 30, 2017 and $4.1 million for the 52 weeks ended December 29, 2018). Additionally, for the 52 weeks ended December 29, 2018, the adjustments are partially offset by approximately $10 million related to transition services previously reported in the Other category that will be retained by VF post-separation. e) Represents intercompany revenue related to transactions between Kontoor and VF that are not expected to continue post-separation. f) In 2019, VF decided to cease its operations in Argentina, including those of Kontoor. g) For the 52 weeks ended December 31, 2016 and December 30, 2017, represents depreciation and amortization for the historical Jeanswear reportable segment and Other category as reported in the VF Form 10- K for the fiscal year ending December 31, 2016 and December 30, 2017, respectively. For the 52 weeks ended December 29, 2018, represents depreciation and amortization reported in the Kontoor Form 10. h) Primarily includes incremental corporate and other costs previously unallocated by VF to the Jeanswear / Jeans reportable segment and other carve-out adjustments of approximately $1 million, $3 million and ($9 million) for the 52 weeks ending December 31, 2016, December 30, 2017 and December 29, 2018, respectively. The incremental allocations for the 52 weeks ended December 31, 2016 included approximately $37 million of U.S. pension costs. i) Represents adjustments to previously allocated depreciation and amortization for the Jeanswear segment for Kontoor carve-out reporting. j) Represents allocated carve-out costs and adjustments that are not expected to continue post-separation or will be replaced by estimated standalone costs and allocated U.S. pension costs of approximately $43 million for the 52 weeks ended December 31, 2016 and approximately $5 million in each of the 52-week periods ending December 30, 2017 and December 29, 2018 that will be retained by VF post-separation. k) Represents restructuring and transaction costs reported in the Kontoor Form 10. l) Represents a full-year estimate of costs associated with being a separate public company. m) Other interest income, net as reported in the Kontoor Form 10. n) Represents a full-year estimate of interest costs, including amortization of debt issuance costs, associated with anticipated debt offering as reported within the Kontoor Form 10. 48
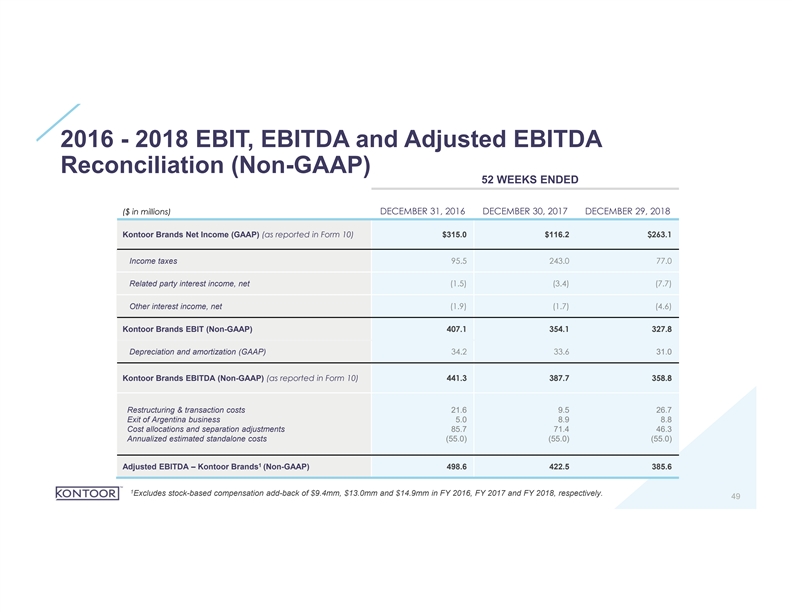
2016 - 2018 EBIT, EBITDA and Adjusted EBITDA Reconciliation (Non-GAAP) 52 WEEKS ENDED DECEMBER 31, 2016 DECEMBER 30, 2017 DECEMBER 29, 2018 ($ in millions) Kontoor Brands Net Income (GAAP) (as reported in Form 10) $315.0 $116.2 $263.1 Income taxes 95.5 243.0 77.0 Related party interest income, net (1.5) (3.4) (7.7) Other interest income, net (1.9) (1.7) (4.6) Kontoor Brands EBIT (Non-GAAP) 407.1 354.1 327.8 Depreciation and amortization (GAAP) 34.2 33.6 31.0 Kontoor Brands EBITDA (Non-GAAP) (as reported in Form 10) 441.3 387.7 358.8 Restructuring & transaction costs 21.6 9.5 26.7 Exit of Argentina business 5.0 8.9 8.8 Cost allocations and separation adjustments 85.7 71.4 46.3 Annualized estimated standalone costs (55.0) (55.0) (55.0) 1 Adjusted EBITDA – Kontoor Brands (Non-GAAP) 498.6 422.5 385.6 1 Excludes stock-based compensation add-back of $9.4mm, $13.0mm and $14.9mm in FY 2016, FY 2017 and FY 2018, respectively. 492016 - 2018 EBIT, EBITDA and Adjusted EBITDA Reconciliation (Non-GAAP) 52 WEEKS ENDED DECEMBER 31, 2016 DECEMBER 30, 2017 DECEMBER 29, 2018 ($ in millions) Kontoor Brands Net Income (GAAP) (as reported in Form 10) $315.0 $116.2 $263.1 Income taxes 95.5 243.0 77.0 Related party interest income, net (1.5) (3.4) (7.7) Other interest income, net (1.9) (1.7) (4.6) Kontoor Brands EBIT (Non-GAAP) 407.1 354.1 327.8 Depreciation and amortization (GAAP) 34.2 33.6 31.0 Kontoor Brands EBITDA (Non-GAAP) (as reported in Form 10) 441.3 387.7 358.8 Restructuring & transaction costs 21.6 9.5 26.7 Exit of Argentina business 5.0 8.9 8.8 Cost allocations and separation adjustments 85.7 71.4 46.3 Annualized estimated standalone costs (55.0) (55.0) (55.0) 1 Adjusted EBITDA – Kontoor Brands (Non-GAAP) 498.6 422.5 385.6 1 Excludes stock-based compensation add-back of $9.4mm, $13.0mm and $14.9mm in FY 2016, FY 2017 and FY 2018, respectively. 49
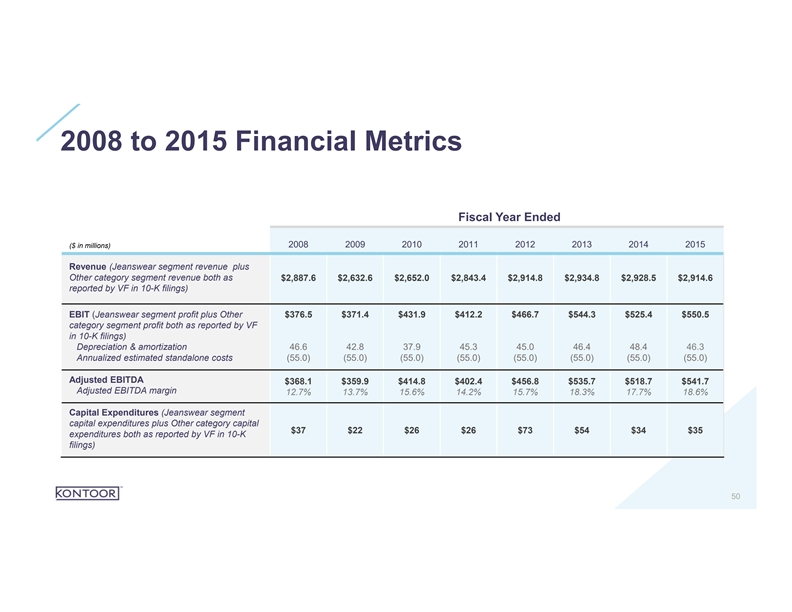
2008 to 2015 Financial Metrics Fiscal Year Ended ($ in millions) 2008 2009 2010 2011 2012 2013 2014 2015 Revenue (Jeanswear segment revenue plus Other category segment revenue both as $2,887.6 $2,632.6 $2,652.0 $2,843.4 $2,914.8 $2,934.8 $2,928.5 $2,914.6 reported by VF in 10-K filings) EBIT (Jeanswear segment profit plus Other $376.5 $371.4 $431.9 $412.2 $466.7 $544.3 $525.4 $550.5 category segment profit both as reported by VF in 10-K filings) Depreciation & amortization 46.6 42.8 37.9 45.3 45.0 46.4 48.4 46.3 Annualized estimated standalone costs (55.0) (55.0) (55.0) (55.0) (55.0) (55.0) (55.0) (55.0) Adjusted EBITDA $368.1 $359.9 $414.8 $402.4 $456.8 $535.7 $518.7 $541.7 Adjusted EBITDA margin 12.7% 13.7% 15.6% 14.2% 15.7% 18.3% 17.7% 18.6% Capital Expenditures (Jeanswear segment capital expenditures plus Other category capital $37 $22 $26 $26 $73 $54 $34 $35 expenditures both as reported by VF in 10-K filings) 502008 to 2015 Financial Metrics Fiscal Year Ended ($ in millions) 2008 2009 2010 2011 2012 2013 2014 2015 Revenue (Jeanswear segment revenue plus Other category segment revenue both as $2,887.6 $2,632.6 $2,652.0 $2,843.4 $2,914.8 $2,934.8 $2,928.5 $2,914.6 reported by VF in 10-K filings) EBIT (Jeanswear segment profit plus Other $376.5 $371.4 $431.9 $412.2 $466.7 $544.3 $525.4 $550.5 category segment profit both as reported by VF in 10-K filings) Depreciation & amortization 46.6 42.8 37.9 45.3 45.0 46.4 48.4 46.3 Annualized estimated standalone costs (55.0) (55.0) (55.0) (55.0) (55.0) (55.0) (55.0) (55.0) Adjusted EBITDA $368.1 $359.9 $414.8 $402.4 $456.8 $535.7 $518.7 $541.7 Adjusted EBITDA margin 12.7% 13.7% 15.6% 14.2% 15.7% 18.3% 17.7% 18.6% Capital Expenditures (Jeanswear segment capital expenditures plus Other category capital $37 $22 $26 $26 $73 $54 $34 $35 expenditures both as reported by VF in 10-K filings) 50
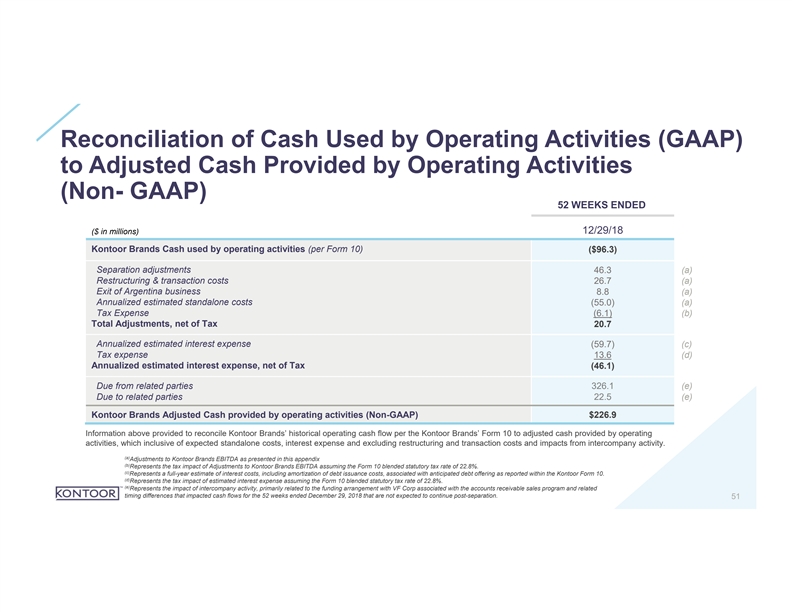
Reconciliation of Cash Used by Operating Activities (GAAP) to Adjusted Cash Provided by Operating Activities (Non- GAAP) 52 WEEKS ENDED ($ in millions) 12/29/18 Kontoor Brands Cash used by operating activities (per Form 10) ($96.3) Separation adjustments 46.3 (a) Restructuring & transaction costs 26.7 (a) Exit of Argentina business 8.8 (a) Annualized estimated standalone costs (55.0) (a) Tax Expense (6.1) (b) Total Adjustments, net of Tax 20.7 Annualized estimated interest expense (59.7) (c) Tax expense 13.6 (d) Annualized estimated interest expense, net of Tax (46.1) Due from related parties 326.1 (e) Due to related parties 22.5 (e) Kontoor Brands Adjusted Cash provided by operating activities (Non-GAAP) $226.9 Information above provided to reconcile Kontoor Brands’ historical operating cash flow per the Kontoor Brands’ Form 10 to adjusted cash provided by operating activities, which inclusive of expected standalone costs, interest expense and excluding restructuring and transaction costs and impacts from intercompany activity. (a) Adjustments to Kontoor Brands EBITDA as presented in this appendix (b) Represents the tax impact of Adjustments to Kontoor Brands EBITDA assuming the Form 10 blended statutory tax rate of 22.8%. (c) Represents a full-year estimate of interest costs, including amortization of debt issuance costs, associated with anticipated debt offering as reported within the Kontoor Form 10. (d) Represents the tax impact of estimated interest expense assuming the Form 10 blended statutory tax rate of 22.8%. (e) Represents the impact of intercompany activity, primarily related to the funding arrangement with VF Corp associated with the accounts receivable sales program and related timing differences that impacted cash flows for the 52 weeks ended December 29, 2018 that are not expected to continue post-separation. 51Reconciliation of Cash Used by Operating Activities (GAAP) to Adjusted Cash Provided by Operating Activities (Non- GAAP) 52 WEEKS ENDED ($ in millions) 12/29/18 Kontoor Brands Cash used by operating activities (per Form 10) ($96.3) Separation adjustments 46.3 (a) Restructuring & transaction costs 26.7 (a) Exit of Argentina business 8.8 (a) Annualized estimated standalone costs (55.0) (a) Tax Expense (6.1) (b) Total Adjustments, net of Tax 20.7 Annualized estimated interest expense (59.7) (c) Tax expense 13.6 (d) Annualized estimated interest expense, net of Tax (46.1) Due from related parties 326.1 (e) Due to related parties 22.5 (e) Kontoor Brands Adjusted Cash provided by operating activities (Non-GAAP) $226.9 Information above provided to reconcile Kontoor Brands’ historical operating cash flow per the Kontoor Brands’ Form 10 to adjusted cash provided by operating activities, which inclusive of expected standalone costs, interest expense and excluding restructuring and transaction costs and impacts from intercompany activity. (a) Adjustments to Kontoor Brands EBITDA as presented in this appendix (b) Represents the tax impact of Adjustments to Kontoor Brands EBITDA assuming the Form 10 blended statutory tax rate of 22.8%. (c) Represents a full-year estimate of interest costs, including amortization of debt issuance costs, associated with anticipated debt offering as reported within the Kontoor Form 10. (d) Represents the tax impact of estimated interest expense assuming the Form 10 blended statutory tax rate of 22.8%. (e) Represents the impact of intercompany activity, primarily related to the funding arrangement with VF Corp associated with the accounts receivable sales program and related timing differences that impacted cash flows for the 52 weeks ended December 29, 2018 that are not expected to continue post-separation. 51
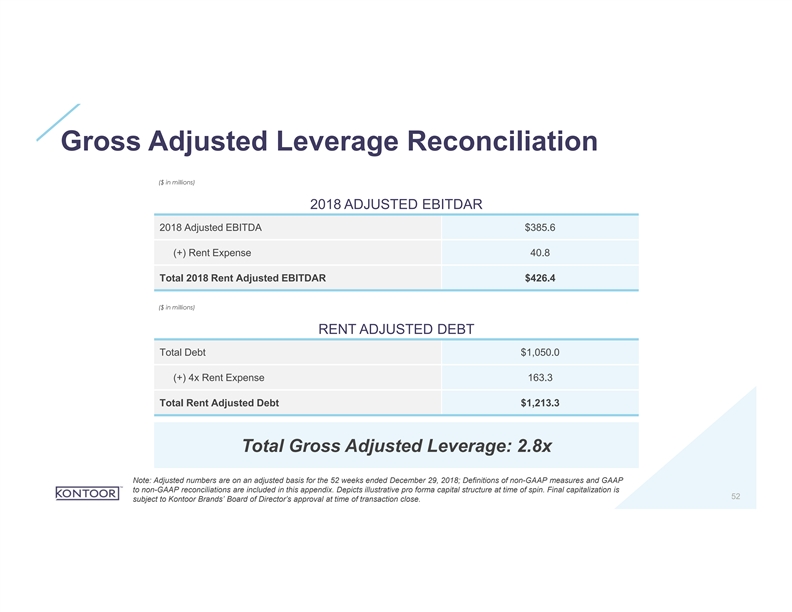
Gross Adjusted Leverage Reconciliation ($ in millions) 2018 ADJUSTED EBITDAR 2018 Adjusted EBITDA $385.6 (+) Rent Expense 40.8 Total 2018 Rent Adjusted EBITDAR $426.4 ($ in millions) RENT ADJUSTED DEBT Total Debt $1,050.0 (+) 4x Rent Expense 163.3 Total Rent Adjusted Debt $1,213.3 Total Gross Adjusted Leverage: 2.8x Note: Adjusted numbers are on an adjusted basis for the 52 weeks ended December 29, 2018; Definitions of non-GAAP measures and GAAP to non-GAAP reconciliations are included in this appendix. Depicts illustrative pro forma capital structure at time of spin. Final capitalization is 52 subject to Kontoor Brands’ Board of Director’s approval at time of transaction close.Gross Adjusted Leverage Reconciliation ($ in millions) 2018 ADJUSTED EBITDAR 2018 Adjusted EBITDA $385.6 (+) Rent Expense 40.8 Total 2018 Rent Adjusted EBITDAR $426.4 ($ in millions) RENT ADJUSTED DEBT Total Debt $1,050.0 (+) 4x Rent Expense 163.3 Total Rent Adjusted Debt $1,213.3 Total Gross Adjusted Leverage: 2.8x Note: Adjusted numbers are on an adjusted basis for the 52 weeks ended December 29, 2018; Definitions of non-GAAP measures and GAAP to non-GAAP reconciliations are included in this appendix. Depicts illustrative pro forma capital structure at time of spin. Final capitalization is 52 subject to Kontoor Brands’ Board of Director’s approval at time of transaction close.